
On November 3, 2026, elections were held in the United States for all 435 seats in the House of Representatives (“House”) and 35 seats in the Senate, as well as for governor in 36 states. While votes are still being counted in a handful of House elections, with two in Louisiana going to a runoff on December 12, Democrats had a historic nationwide landslide. Here are my tracking sheets from Election Day.
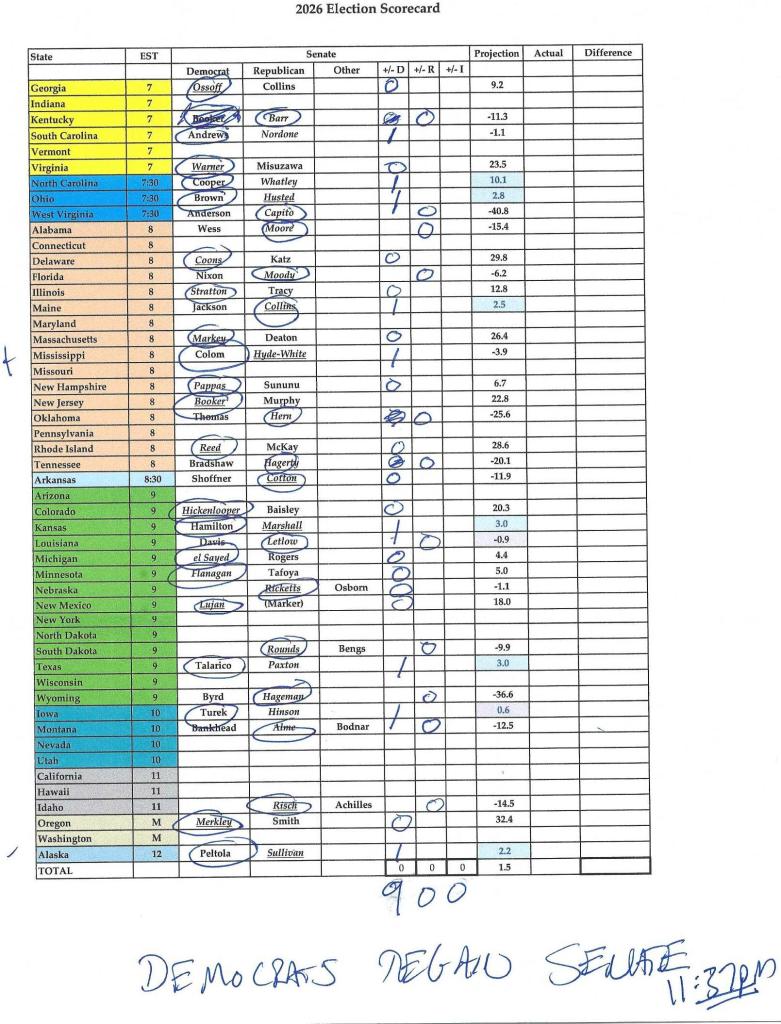
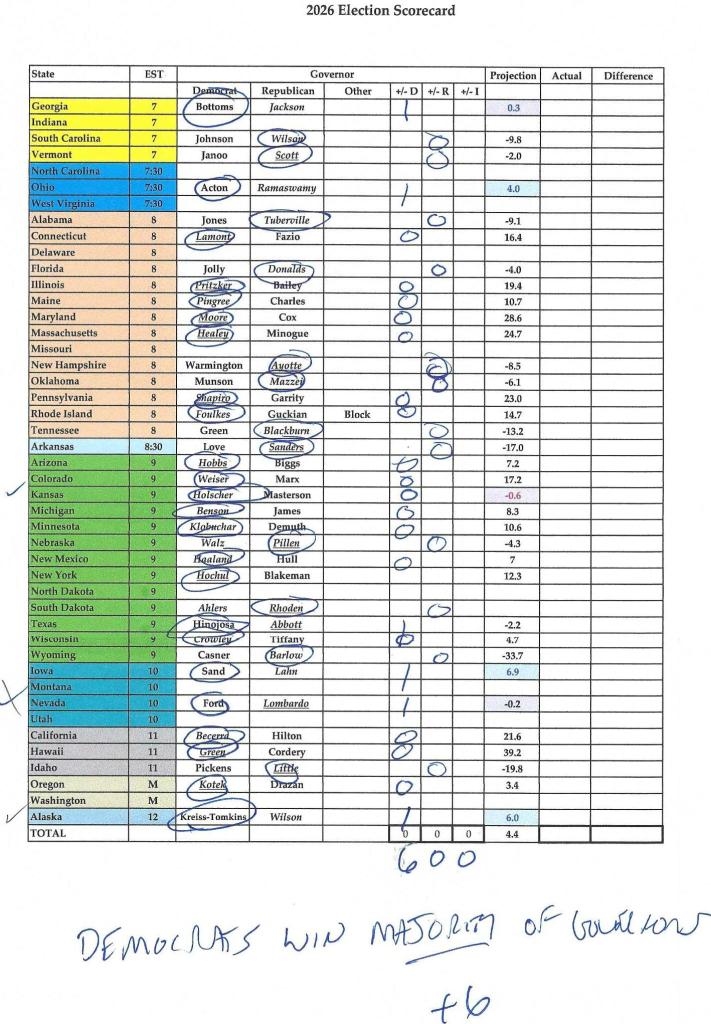
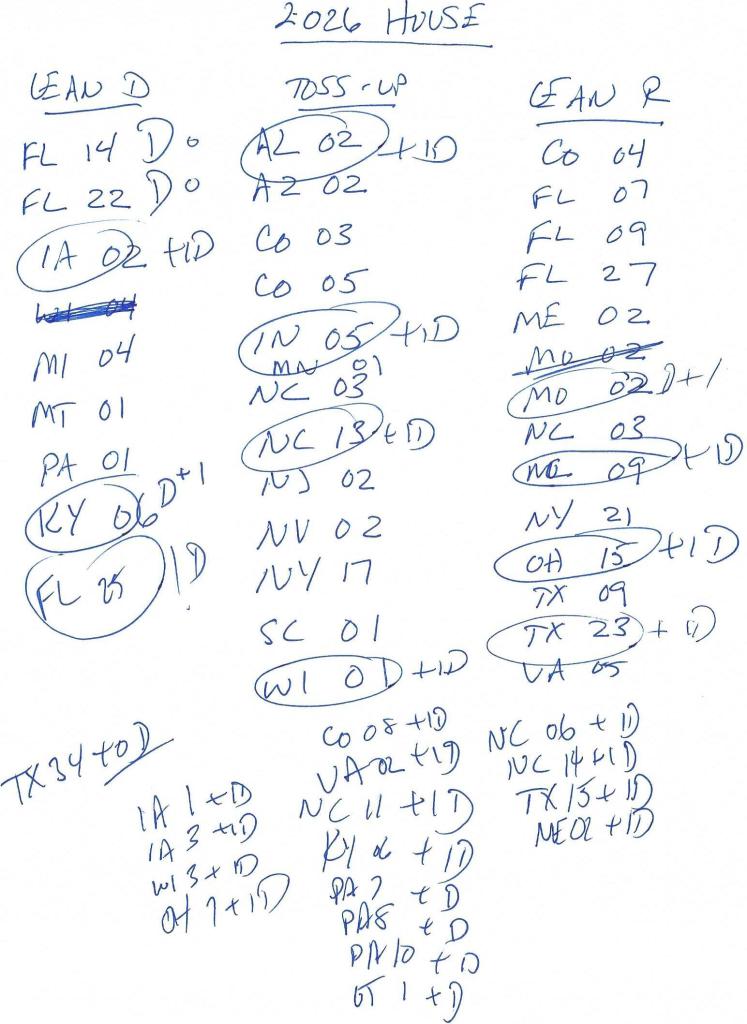
Democrats won majorities in the House and Senate for the first time since 2022 and 2024, respectively. A majority of governors (30) will be Democrats for the first time since 2010. If every current lead holds (and a Republican wins both Louisiana runoff elections), Democrats will hold 260 seats in the House when Congress convenes on January 3, 2027. This 85-seat majority will be their largest since they held 267 House seats following the 1990 elections. Democrats will also control 56 Senate seats, counting two Independents who caucus with Democrats.[1] The last time Democrats held at least 56 seats was after the 2008 elections, when they held 59.[2]
The last time Democrats had this numeric combination of House seats, Senate seats and governor’s mansions was after the 1992 elections. However, many of those Democrats were conservative Southerners, making these probably the most center-left Democratic majorities ever.
Unless otherwise stated, election data come from the Associated Press.
***********
Throughout the fall of 2026, I regularly updated forecasts of Senate and gubernatorial elections, primarily through 1) probability distributions of the number of post-election Democratic Senators and governors and 2) tables showing the likelihood of Democratic victories in the Senate and gubernatorial elections with a projected margin of less than 7.5 percentage points (“points”). Both final tables listed 14 elections.
I derived these forecasts from a time-weighted average of fundamentals and polling. Fundamentals – essentially, how a generic Democrat would fare against a generic Republican, based on recent elections – are the sum of national partisan lean, state partisan lean and an adjustment for incumbency/open seat. I estimated national partisan lean using regularly-updated polls of the generic ballot.[3] From the generic ballot, I also estimated how many House seats Democrats would hold after the 2026 elections.
So, how well did polling – and, by extension, my forecasts – fare in the 2026 elections?
House/Generic Ballot
A total of 442 generic ballot polls were conducted between November 4, 2025 and November 2, 2026. My final time-weighted polling average (“TWPA”)[4] showed Democrats leading Republicans by 7.6 percentage points (“points”), 49.4% to 41.8%. The lead in the final 10 polls, conducted on October 22 or later, was 9.0 points, 52.7% to 43.7%. Notably, while the proportion choosing Democrats increased after Labor Day from 47.0% to 50.0%, Republicans remained mired at 41.9%. Undecided voters thus steadily became Democratic voters over the course of the year, with this shift accelerating in September and October.
Democrats currently lead all House votes cast nationwide by 14.0 points (with rounding): 56.2% to 42.3%. TWPA thus underestimated Democratic strength in House elections by 6.3 points. Put another way, Democrats overperformed the final TWPA by 6.8 points, while Republicans overperformed by only 0.5 points, with the typical 1.6 points for third-party candidates. The final 10 polls underestimated Democratic House strength by 4.9 points, as Democrats overperformed by 3.5 points while Republicans actually underperformed by 1.4 points.
Table 1 compares final TWPA to the national House Democratic margin for the 36 pollsters who conducted at least three generic ballot polls this cycle. These pollsters account for 92.1% (n=407) of assessed generic ballot polls. Pollsters are sorted by difference from national House Democratic margin, smallest to largest. Pollsters in blue are Democratic-leaning (based upon ownership and clientele), those in red are Republican-leaning and the rest are non-partisan. AtlasIntel is based in Brazil, making it difficult to classify. Beacon Research and Shaw & Company Research jointly conduct the Fox News Poll, while Hart Research Associates and Public Opinion Strategies jointly conduct polling for NBC News.
Table 1: Generic Ballot TWPA by Pollster
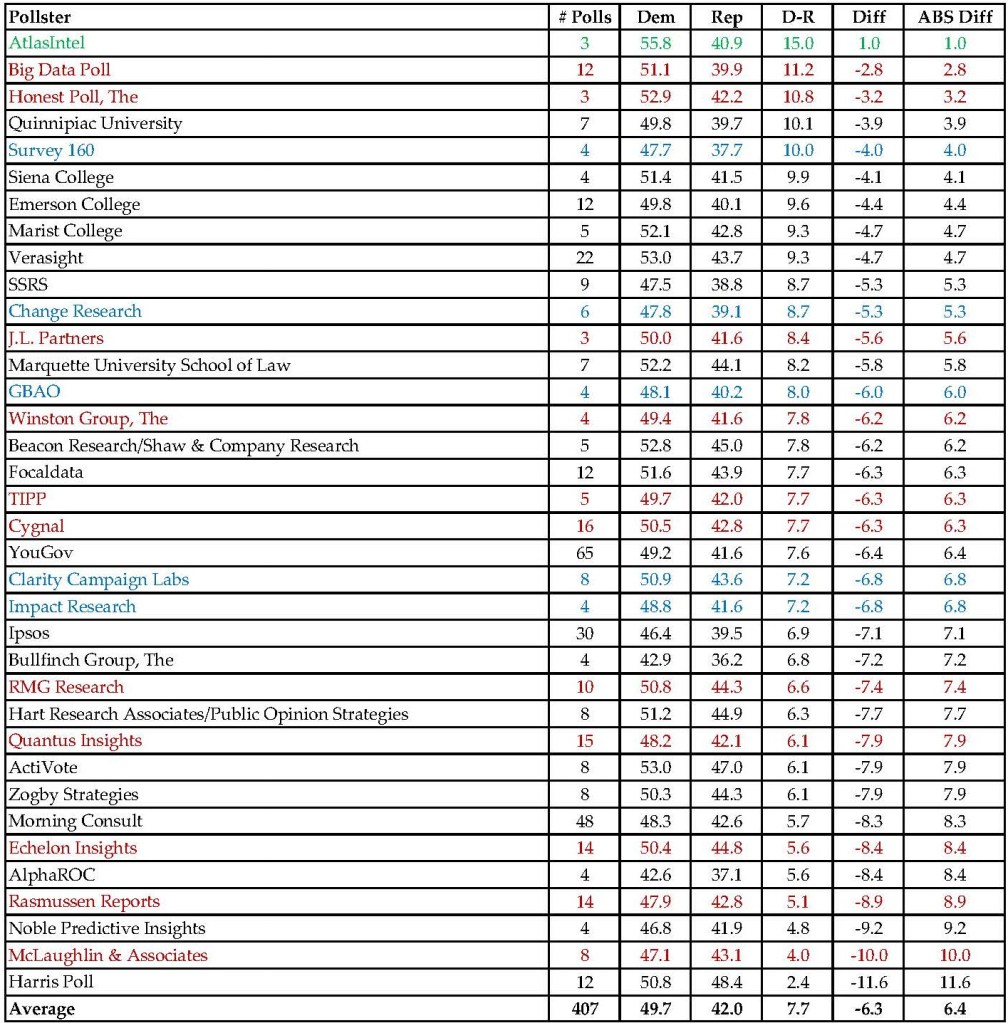
While all 36 pollsters correctly assessed that Democrats would win more House votes than Republicans nationwide in 2026, they underestimated the size of that margin by an average of 6.3 points. AtlasIntel was the only pollster to overestimate Democratic strength, and then only by 1.0 points. Two Republican-leaning pollsters – Big Data Poll and The Honest Poll – each missed by around three points. Only five non-partisan pollsters came within five points of the national Democratic House margin: Verasight and Marist College (-4.7 points), Emerson College (-4.4), Siena College (-4.1) and Quinnipiac University (-3.9). By contrast, the Harris Poll – who worked with Harvard’s Center for American Political Studies this cycle – underestimated Democratic strength by a staggering 11.5 points, followed by the Republican-leaning McLaughlin & Associates at 10.0 points. Finally, the three most prolific generic ballot pollsters – Ipsos (n=30), Morning Consult (48) and YouGov (65) – who accounted for roughly one-third of assessed generic ballot polls, underestimated the national Democratic House margin by 7.0, 6.3 and 8.2 points, respectively.
There was only a small partisan distinction in assessing the 2026 generic ballot. The five Democratic-leaning pollsters conducted 26 polls, with average percentages of 48.6% Democratic and 40.4% Republican, for an overall Democratic underestimation of 5.7 points. The 11 Republican-leaning (104 polls) and 19 non-partisan (274) pollsters yield nearly identical percentages, on average: 49.8% and 49.6% Democratic, and 42.5% and 42.3% Republican, respectively. These margins underestimated the final Democratic House margin by 6.5 and 6.6 points, respectively.
Using the generic ballot TWPA of 7.6% in my single-variable model of increase in Democratic seats[5] yielded an estimated Democratic gain of 31.7 seats, with a 95% confidence interval (“CI”) of 21.6 to 41.9. The actual Democratic gain of 45 seats falls outside the upper range. Using the actual margin of 14.0 points suggests a gain of 51.9 seats, with a 95% CI of 37.9 to 65.8.
Senate
Based strictly on the forecasted Democratic margin, the only 2026 Senate elections I “mis-called” were in Mississippi and South Carolina. I underestimated the winning margins for Democrats Scott Colom and Annie Andrews by 4.7 and 5.6 points, respectively. I correctly forecast that Democrat Jamie Davis would lose by a far narrower margin than expected in Louisiana.
Across 35 Senate elections in 2026, Democrats topped Republicans by 9.4 points, 53.5% to 44.1%. That is, the combined electorates of these states were 4.6 points more Republican than the nation as a whole, based upon the House vote. When I calculated fundamentals for Senate races, I estimated this difference would only be 1.0 points, or D+6.5, based on a weighted average of the last six even-year elections.[6]
Six Senate elections – Delaware, New Jersey, Oregon, Virginia, West Virginia and Wyoming – were not polled at all, so I used fundamentals to forecast these elections. The single poll of the Oklahoma Senate election underestimated Democratic strength by 7.7 points, while the 26 polls in the Alaska Senate election mixed first-place votes with the final results of ranked choice voting, making a clean comparison difficult, though they did correctly point to Mary Peltola as the winner.
Table 2: Comparing Polling Averages to Results in 27 Senate Elections, 2026
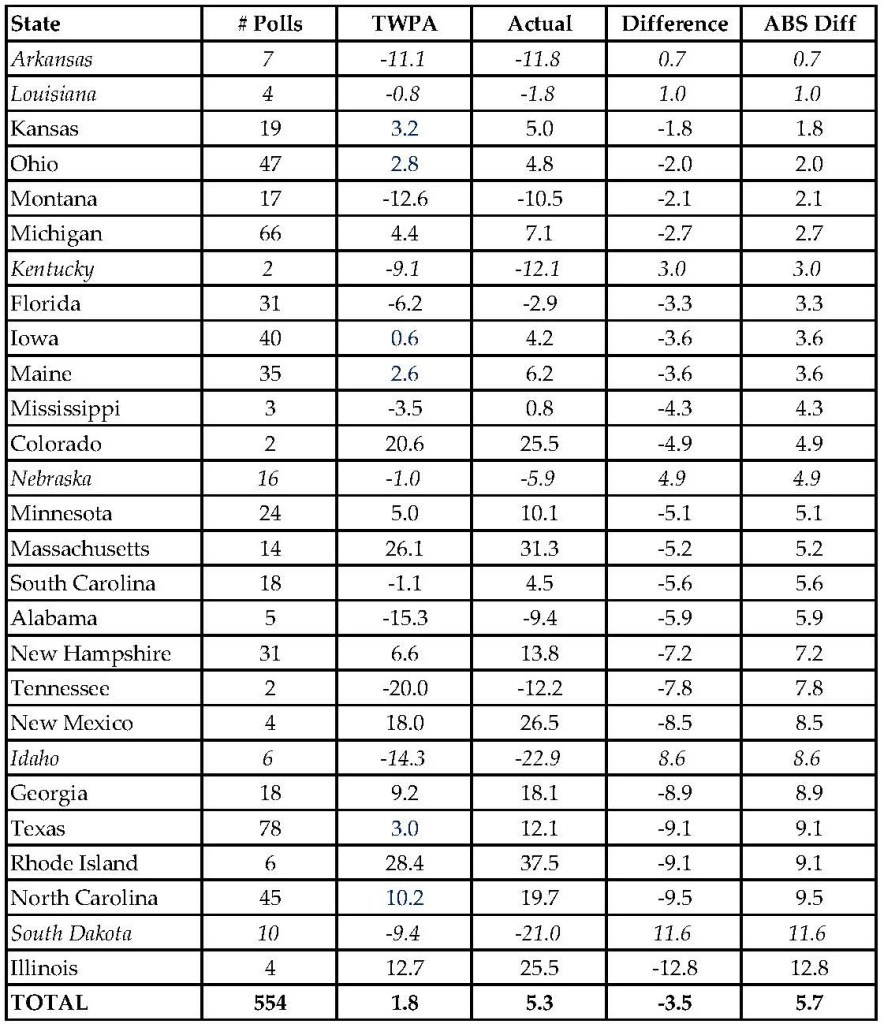
This leaves 27 Senate elections with at least two polls and a clean comparison, as shown in Table 2 above. For the Senate elections in Idaho (Todd Achilles), Montana (Seth Bodnar), Nebraska (Dan Osborn) and South Dakota (Brian Bengs), I substituted the Independent for the Democrat. States in italics saw TWPA overestimate Democratic margins. Note that TWPA differs slightly (<1.0) from forecasted margins because it does not include fundamentals, which accounted for an average 6% of the forecast.
On average, polls underestimated the Democratic margin in Senate elections in 2026 by 3.5 points, or 5.6 points ignoring direction. These values fall just within historic parameters. Democrats actually underperformed their final polling margins in six Senate elections: Arkansas, Kentucky, Louisiana, Nebraska, Idaho and South Dakota. Arkansas and Louisiana had the most accurate Senate polling in 2026, with each showing a difference of 1.0 point or less. Other states with a Senate polling miss of less than 3.0 points were Kansas (-1.8), Ohio (-2.0), Montana (-2.1) and Michigan (-2.7).
By contrast, polling underestimated Democrat Juliana Stratton in Illinois by 12.8 points, while overestimating Bengs in South Dakota by 11.6 points. In the increasingly-Democratic states of Georgia, North Carolina and Texas, finally, the 141 total polls underestimated the winning margins for Jon Ossoff, Roy Cooper and James Talarico by an average of 9.2 points.
Governor
Based strictly on the forecasted Democratic margin, the only 2026 gubernatorial elections I “mis-called” were in Kansas, Nevada and Texas, underestimating the winning margins for Democrats Cindy Holscher, Aaron Ford and Gina Hinojosa by 1.2, 7.8 and 9.3 points, respectively.
Across 36 gubernatorial elections in 2026, Democrats topped Republicans by 13.4 points, 55.7% to 42.3%. That is, the combined electorates of these states were only 0.6 points more Republican than the nation as a whole, based upon the House vote. When I calculated fundamentals for gubernatorial elections, I estimated this difference would only be 0.9 points, or D+6.6, based on a weighted average of the last six even-year elections.[7]
The gubernatorial elections in Hawaii and Wyoming were not polled at all, meaning I used fundamentals to forecast these elections. The 17 polls in the Alaska gubernatorial election mixed first-place votes with the final results of ranked choice voting, making a clean comparison difficult, though they did correctly point to Jonathan Kreiss-Tomkins as the winner.
Table 3: Comparing Polling Averages to Results in 33 Gubernatorial Elections, 2026
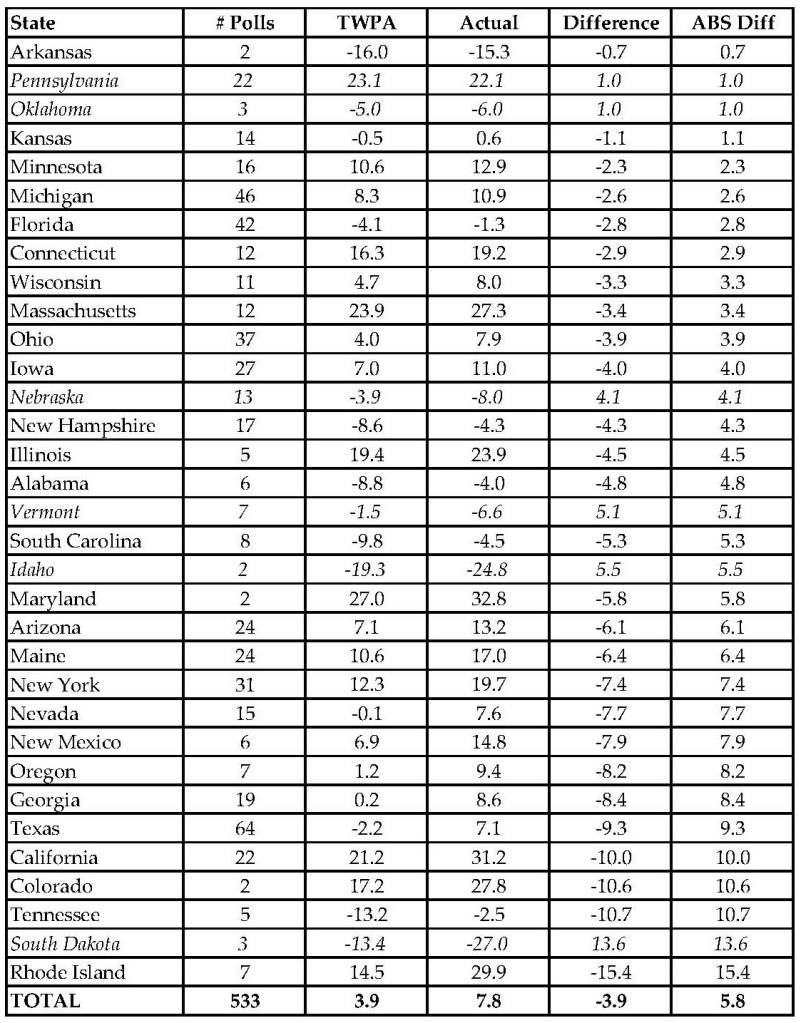
This leaves 33 gubernatorial elections with at least two polls and a clean comparison, as shown in Table 2 above. States in italics saw TWPA overestimate Democratic margins. Note that TWPA differs slightly (<2.5) from forecasted margins because it does not include fundamentals, which accounted for an average 2% of the forecast.
On average, polls underestimated the Democratic margin in 2026 gubernatorial elections by 3.9 points, or 5.8 points ignoring direction. These values are just barely within historic parameters. Democrats actually underperformed TWPA in six gubernatorial elections: Idaho, Nebraska, Oklahoma, Pennsylvania, South Dakota and Vermont. That said, Oklahoma and Pennsylvania (1.0) join Arkansas (-0.7) and Kansas (-1.1) with the most accurate gubernatorial polling in 2026. Other states with a gubernatorial polling miss of less than 3.0 points were Minnesota (-2.3), Michigan (-2.6), Florida (-2.8) and Connecticut (-2.9).
By contrast, polling underestimated Democrats Xavier Becerra (California), Phil Weiser (Colorado), Jerri Green (Tennessee) and Helena Foulkes (Rhode Island) by an average of 11.7 points, while overestimating Dan Ahlers in South Dakota by 13.6 points. In the increasingly-Democratic states of Georgia and Texas, finally, the 141 total polls underestimated the winning margins for Keisha Lance Bottoms and Hinojosa by an average of 8.8 points.
***********
Polling was accurate in 2026 in that it suggested Democrats were poised to win majorities in the House and Senate, as well as a majority of governor’s mansions. Where polling erred, though, was in substantially underestimating Democratic margins, especially in southern states with large minority populations like Georgia, North Carolina, South Carolina, Tennessee and Texas. The opposite was true in the western, very-white states of Idaho, Nebraska and South Dakota. While polling misses were (barely) within historic parameters for Senate (-3.5) and gubernatorial elections (-3.9), they underestimated the national margin in the House vote by 6.3 points. Moreover, actual Election Day margins fell outside my proposed range of +/-4 points in 17 Senate and 21 gubernatorial elections, which is just over half (54%) of this years’ elections.
But, what of individual pollsters?
Table 4 below lists the 42 pollsters that assessed at least one 2026 Senate or gubernatorial election at least three times. I exclude the 17 Senate and gubernatorial polls conducted by Alaska Survey Research and three Alaska Senate polls conducted by Siena College. As with Table 1, pollsters are color-coded by ownership/clientele partisanship.
Table 4: Pollster Performance in Senate and Gubernatorial Elections, 2026
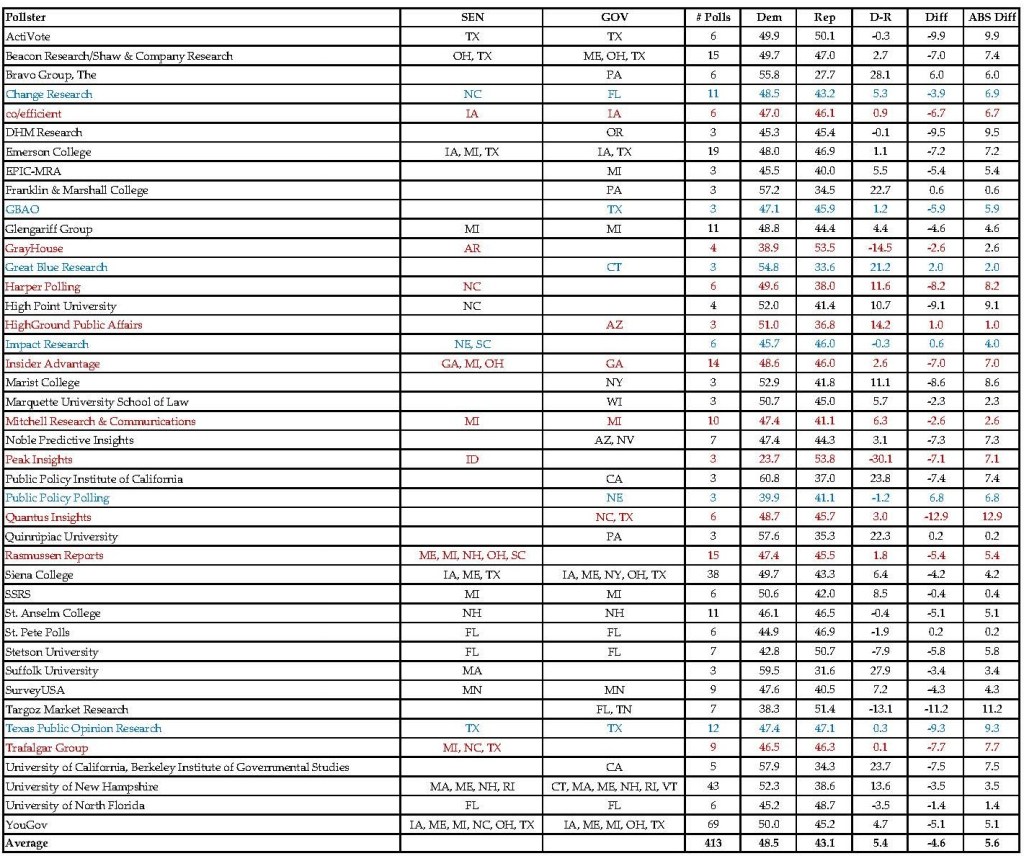
These pollsters account for 36.5% (413) of the 1,133 Senate and gubernatorial election polls conducted between November 4, 2025 and November 2, 2026. Overall, they forecast an electorate that was 5.4 points more Democratic than Republican, 48.5% to 43.1%. This was 6.0 points lower than the actual combined Senate and gubernatorial margin of D+11.4. In the elections they assessed, these pollsters underestimated Democratic margins by 4.6 margins, or 5.6 points ignoring direction. These differences lie well outside historic parameters.
There were modest differences by partisan orientation, though non-overlapping combinations of elections make comparisons tricky. Six Democratic-leaning pollsters conducted a total of 38 polls in nine elections. On average, they had the Democrat ahead 4.4 points, 47.2% to 42.8%. This underestimated Democratic strength by a relatively close 1.6 points, or 5.8 points ignoring direction. Ten Republican-leaning pollsters conducted a total of 76 polls in 22 elections. On average, they had the Democrat behind -0.6 points, 44.6% to 45.2%. This underestimated Democratic strength by 6.0 points, or 6.2 points ignoring direction. The remaining 26 non-partisan pollsters conducted 299 polls in 71 elections. On average, they had the Democratic ahead 7.9 points, 50.3% to 42.3%. This underestimated Democratic strength by 4.7 points, or 5.3 points ignoring direction. Thus, while Republican-leaning pollsters were the most accurate, by far, in 2024, they were widest of the mark in 2026. Democratic pollsters, meanwhile, barely engaged this cycle.
Only five pollsters assessed multiple Senate and gubernatorial elections this cycle: University of New Hampshire (-3.5, 3.5), Siena College (-4.2, 4.2), YouGov (-5.1, 5.1), Emerson College (-7.2, 7.2) and Beacon Research/Shaw & Company Research (Fox News; -7.0, 7.4). Only the University of New Hampshire, who polled the 10 Senate and gubernatorial elections in New England in 2026 multiple times, was within four points of the final margins on average. The usually reliable Emerson College and Fox News polls were among the worst this cycle.
By contrast, some pollsters who assessed only one state this cycle were extremely accurate. Franklin and Marshall College and Quinnipiac University missed Democratic Governor Josh Shapiro’s winning margin in Pennsylvania by less than one point. St. Pete Polls and the University of North Florida missed the Florida Senate and gubernatorial margins by an average of 0.2 and 1.4 points, respectively. SSRS came within 0.4 points, on average, of the Michigan Senate and gubernatorial elections. And Republican-leaning High Ground Public Affairs came within 1.0 point of Democratic Governor Katie Hobbs’ winning margin in Arizona.
That being said, 29 of these pollsters (69%) had an average higher than 4.0 points, the historic parameter I used to denote the likely upper and lower bounds of my forecasted margins.
So, what went wrong in 2026?
Recall that any single poll measures hypothetical vote choices in a randomly-selected group of potential voters, adjusted to reflect the electorate the pollster deems most likely. Examine the crosstabs of any poll, and you will see just how soft these vote choices often are. The topline numbers reported by media organizations represent a sum of firm and soft choices. Pollsters also have different ways of determining who is “likely” to vote, much of which is educated guesswork prone to unconscious partisan biases.
Further recall that in my assessment of 2024 polling, I observed that when Donald Trump appeared on the ballot, Republican candidates overperformed polling averages by 2.5 points. Pollsters appear to have overcompensated for successive undercounts of Republican voters by adjusting for the 2016, 2020 and 2024 electorates. Even as Democrats were overperforming in special elections by an average of 15 points, being the majority of primary electorates and displaying higher enthusiasm, pollsters chose – not unreasonably – to err on the side of catching every hidden Republican voter.
It is highly telling that the Democratic surge in the generic ballot began in early October, at the start of early voting. Pollsters were now capturing actual, not hypothetical, votes. And yet they still missed an electorate that decided to vote Democratic – or not to vote at all – in the last days of the campaign.
In short, pollsters succumbed to a form of understandable, if foolish in hindsight, recency bias, modeling past electorates while ignoring the signs of the emerging electorate. In so doing, they got the direction of the results correct – a strong Democratic performance across the board – while badly underestimating its magnitude.
And now they get to make adjustments – more educated guesses – for 2028.
Until next time…and if you like what you read here, please consider making a donation. Thank you!
[1] Angus King of Maine and Bernie Sanders of Vermont
[2] Including Independents Sanders and Joe Lieberman of Connecticut
[3] A variation of “If the election in your district were held today, would you vote for the Democrat, the Republican, someone else, or nobody?”
[4] Using every publicly-released poll without adjusting for any form of partisan bias or pollster “quality.” The weight was simply what proportion of 365 days had elapsed since November 4, 2025. Polls conducted after Labor Day were weighted 2 times higher, after October 1 3 times higher, after October 15 4 times higher, and after October 26 5 times higher.
[5] Change in Democratic House seats = change in Democratic House vote margin * 3.14 – 0.49
[6] 2020=6, 2014=5, 2018=4, all else=1
[7] 2022=6, 2018=5, 2014=4, all else=1


One thought on “Assessing Polling Accuracy in 2026”