
With Labor Day in the rearview mirror, we address the elections for United States House of Representatives (“House”), United States Senate (“Senate”) and governor that conclude on November 3, 2026.
House. All 435 House seats will be contested. Republicans held a 220-215 edge following the 2024 elections. Democrats need a net gain of three seats for a bare 218-217 majority. However, an unprecedented wave of mid-decade redistricting likely increases that number to between eight and 10. For the purpose of this analysis, Democrats need to net at least 10 seats to regain the majority for the first time in four years.
Senate. There are 35 Senate elections in 2026, including special elections in Florida and Ohio, where appointed incumbents Ashley Moody and Jon Husted, respectively, seek full six-year terms. Republicans are defending 22 seats, with an average partisan lean of R+21.7, while Democrats are defending 13 seats, with an average partisan lean of D+9.0. Partisan lean is measured using 3W-RDM.
Republicans currently hold a 53-47 advantage in the Senate, counting two Independents (Angus King of Maine, Bernie Sanders of Vermont) who caucus with Democrats. With Republican Vice President J.D. Vance breaking a 50-50 tie under the United States Constitution, Democrats need to net at least four seats to regain the majority after two years in the minority.
Governors. There are 36 gubernatorial elections in 2026. Democrats and Republicans are each defending 18 seats, with average partisan leans of D+9.9 and R+16.6, respectively. There are currently 26 Republican governors and 24 Democratic governors. If Democrats net at least two governor’s mansions, they will hold a majority for the first time in 16 years.
***********
When used two broad categories of data to examine elections: fundamentals and polling averages. “Fundamentals” are how I estimate a generic Democrat or Republican would fare in a statewide election based on state partisan lean (3W-RDM), national partisan environment and incumbency. We will return to incumbency. I estimate national partisan environment using a time-weighted average of generic ballot polls.
About 10 years ago, I developed a Weighted-Adjusted Polling Average, or WAPA, using all polls listed on FiveThirtyEight.com. The most important adjustment was time, using the formula (365 – #Days to Election)/365, based on the midpoint of the poll’s field dates. Time weight is 50% lower if the poll was conducted prior to the state’s primary, as well as higher following Labor Day (September 7 in 2026): 2 times for polls conducted after Labor Day but before October 1, 3 times for October 1 to October 15, 5 times for after October 15. Polls with field dates straddling these cut points were weighted between the two values, based upon how many days were before and after.
Over time, I adjusted for additional factors – if a poll was in the field only one day, if topline numbers totaled 100% (i.e., no undecided or third-party choices), whether All Adults were sampled (versus those registered or likely to vote), what letter grade the pollster received from FiveThirtyEight.com, and a rough estimate of how much a poll typically over- or underestimated Democratic share.
However, the FiveThirtyEight.com website was shut down in March 2025, and careful analysis of 2024 election polling led me to conclude that time was the only defensible adjustment. I had to find a new source for public polling, and after some trial and error, I landed on RealClearPolitics and Race to the White House.
Which brings us back to the aggregation of generic ballot polls – those asking a version of “If the election were held today, would you vote for the Democratic candidate, the Republican candidate, a different candidate, or are you undecidede?” – to estimate national partisan environment. As of September 13, 2026, 340 publicly-available generic ballot polls were published on these two sites. I ignore primary elections when time-weighting generic ballot polls.
I still calculate two time-weighted polling averages (“TWPA”), one assuming each poll is statistically-independent, and one using within-pollster time-weighted average as a single “poll.” As of September 13, 2026, 53 pollsters have assessed the generic ballot at least once since November 3, 2025, topped by Cygnal (13), Quantus Insights (14), Verasight (18), Ipsos (23), Morning Consult (38) and YouGov (55). TWPAs for the generic ballot are currently D+5.6 (statistically-independent) and D+6.2 (pollster-distinct). I use the average of these two values: Democrats 47.5%, Republicans 41.6%, Other/Undecided 10.9%. Historically, about 1.5% of the total vote cast for the House nationally goes to third-party candidates, suggesting just under 10% of voters are currently undecided about their House vote.
In previous years, this 5.9% value would have been my estimate of the national partisan environment. However, I decided to estimate a “fundamentals comparison,” as well as a specific adjustment for Senate and gubernatorial elections. For the former, I used the weighted average of the Democratic margin in the total House vote over the last six elections, with midterm elections weighted higher:
“Fundamentals” national House vote =
(6*2022 D margin + 5*2018 D margin + 4*2014 D margin + 3*2024 D margin + 2*2020 D margin + 2016 D margin)/21 = 0.0
The “historic expectation” for the total House vote in 2026 is an even split between Democrats and Republicans.
As of September 13, 2026, based on the most recent generic ballot poll dates, the “expected” total House vote is 0*0.15 + 5.9*0.85 = D+5.0. This would be a gain of 7.7 percentage points over 2024 for Democrats, which translates to a gain of 23.7 House seats (95% CI: 14.9-32.2), well over the 10 needed to regain the majority.[1]
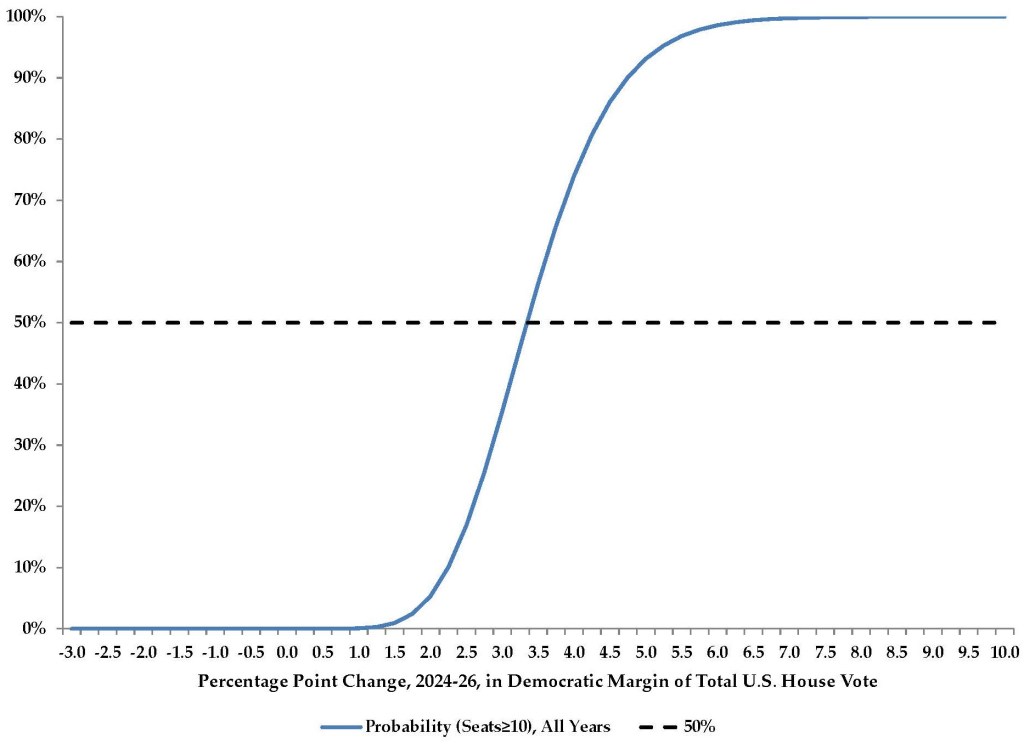
Figure 1 below shows that even if Democrats win the total House vote by “only” 2.0 points in 2026, they would still be 90% favorites to recapture the House majority.
Figure 1: Probability Democrats net 10 or more House seats, based on change in total House margin, 2024-2026
Meanwhile, Democratic shares of the total vote cast for Senate or governor over the last six elections do not quite track their share of the total House. Varying the House weighting to account for this particular Senate class (2014, 2020) and the most recent analogous midterm election (2018), I used this formula to determine how much higher or lower the estimated Democratic share of the total Senate vote would be in 2026:
Difference between total Senate and House Democratic % of vote =
(6*2020 difference + 5*2014 difference + 4*2018 D difference + 2024 difference + 2022 difference + 2016 difference)/18 = -1.0
Thus, if the expected Democratic margin in the total House vote in 2026 is 5.0 points, then the expected Democratic margin in the total Senate vote in 2026 is 5.0 – 1.0 = 4.0 points. As of September 13, 2026, here is the formula for Senate election fundamentals: 3W-RDM + 4.0 + incumbency. I detail how I calculate Senate incumbency advantage – with Democrats having a mean 2.9-point advantage in the 12 Senate seats in which no incumbent is running in 2026 – here.
The logic is similar for gubernatorial elections:
Difference between total gubernatorial and House Democratic % of vote =
(6*2022 difference + 5*2018 difference + 4*2014 D difference + 2024 difference + 2020 difference + 2016 difference)/18 = -0.9
Thus, if the expected Democratic margin in the total House vote in 2026 is 5.0 points, then the expected Democratic margin in the total vote for governor in 2026 is 5.0 – 0.9 = 4.1 points. And as of September 13, 2026, this is the formula for gubernatorial election fundamental: 3W-RDM + 4.1 + incumbency. I detail how I calculate gubernatorial incumbency advantage – with Democrats having a mean 5.6-point advantage in the 19 gubernatorial elections in which no incumbent is running in 2026 – here.
Using these data and formulae, I calculated a fundamentals value for every Senate and gubernatorial election, then used past variations between fundamentals and actual margins to calculate the probability of a Democratic victory based solely on fundamentals.[2]
***********
This brings us to the TWPA for the Senate and gubernatorial elections, calculated as noted above for the 28 Senate and 31 gubernatorial elections with at least one publicly-available poll as of September 13, 2026. The most-polled elections as of this date are Michigan governor (20), North Carolina Senate (25), Michigan Senate (26), Texas governor (26) and Texas Senate (29).
To calculate a polling-average probability of Democratic victory, I first calculated a 95% margin of error using the total number of persons surveyed in that election. To this I added 4 to account for non-randomization polling errors. As with fundamentals, I used the normal distribution (mean = TWPA, standard deviation = adjusted MOE) to calculate the probability of a bare Democratic win.
To combine fundamentals and polling into a single projected final margin and probability of Democratic victory, I used weighting formula detailed above. That is, if the most recent poll in an election was conducted 100 days before Election Day, polls would receive (365-100)/365 = 265/365 = 72.6% of the weight, with 27.4% going to fundamentals. On average, as of September 13, 2026, the polling weight is 81% in Senate elections and 75% in gubernatorial elections, assuming at least one poll. Thus, final forecasted margins and Democratic victory probabilities still somewhat account for voter reversion to historic norms.
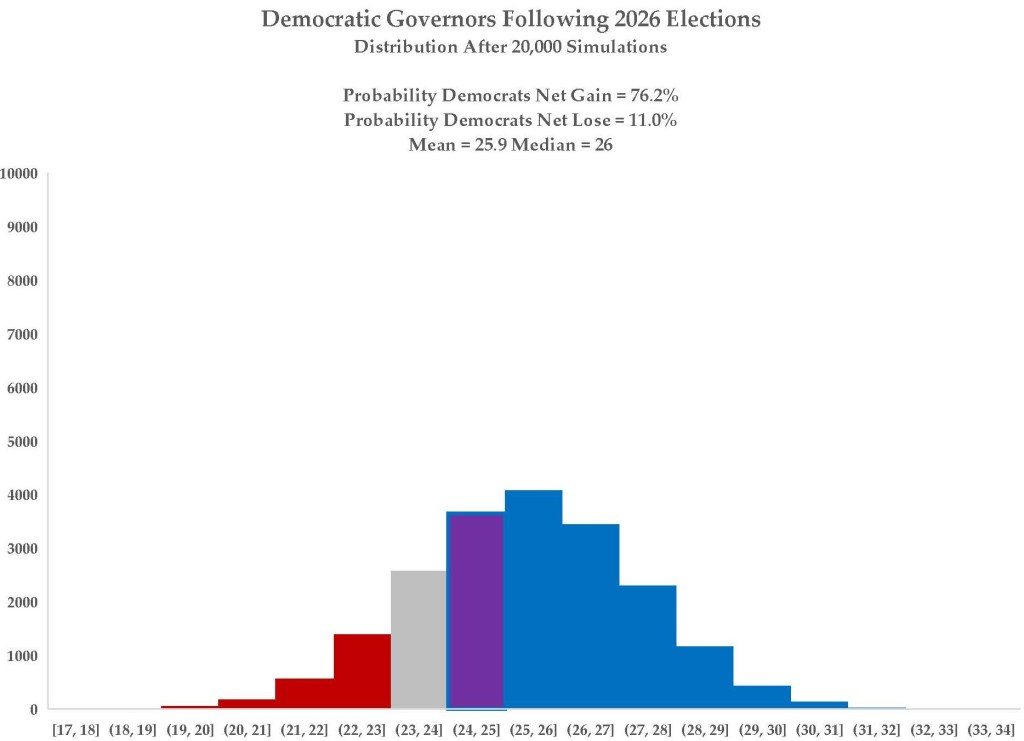
The final step was to take these individual election forecasts and convert them into a global forecast. I did this by generating 20,000 random election cycles, using the combined probability of Democratic victory. I did not adjust for correlated errors because the closest and/or likeliest to flip elections do not follow a simple demographic or geographic pattern. If Figures 2 and 3 below are inaccurate, it is more likely because this random draw does not account for the historic pattern of close elections tending to break in the same partisan way, especially in a “wave” election. Polling and the generic ballot seem to imply that 2026 will be a Democratic wave year.
Full blue columns indicate a majority of either Senate seats (51 or more) or governor’s mansions (26 or more), while columns with a blue outline indicate Democratic gains, but only to a tie (purple) or a non-majority (light red). The gray column indicates status quo ante, with darker red columns indicating a net Democratic loss.
Figure 2: (as of September 13, 2026)
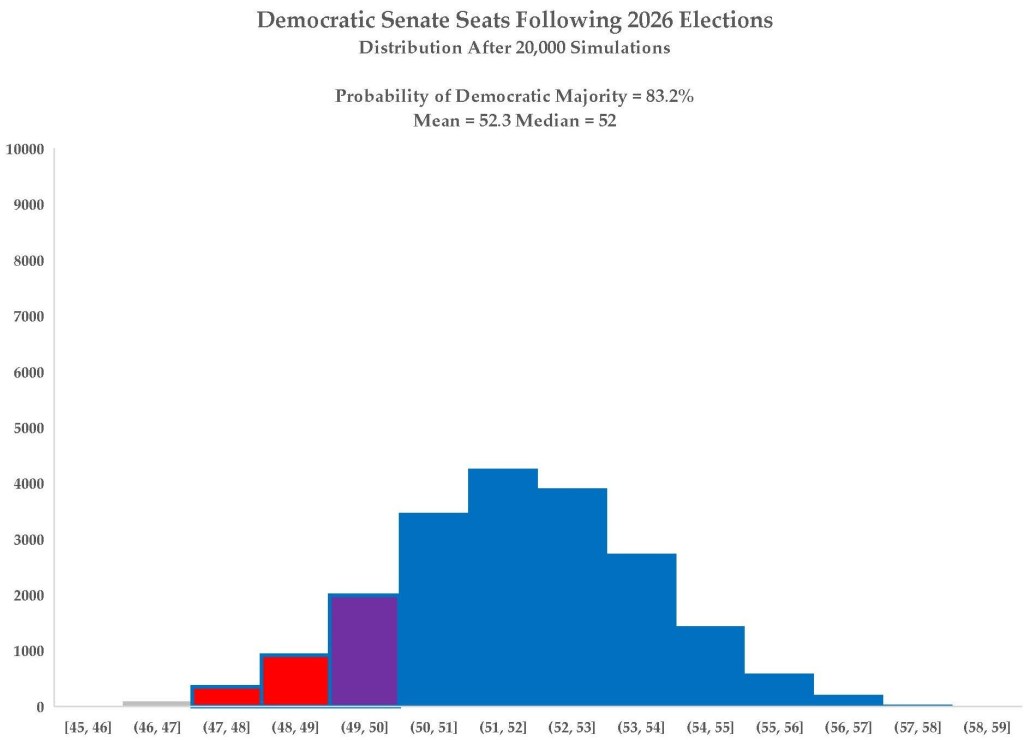
Figure 3: (as of September 13, 2026)
One final note: to account for the possibility polling systematically underestimates or overestimates Democratic margins, I created two separate Senate and gubernatorial election forecasts. The first one assumes every generic ballot and election poll overstates Democratic strength by four points, while the second assumes every generic ballot understates Republican strength by four points. This provides a kind of reality check on all 71 forecasts – the difference between a) Democrats barely regaining the House majority while holding serve elsewhere and b) an absolute Democratic tsunami yielding a 30-seat House majority and a solid Senate majority.
We will learn in less than two months with of these three scenarios comes to pass.
Until next time…and if you like what you read here, please consider making a donation. Thank you!
[1] Based on a simple regression of Democratic gain in House seats on Democratic gain in percentage of total House vote, both from previous election, using data from 1970 to 2024. The formula is House Seat Gain = 3.14*House Margin Gain + 0.49, r-squared = 0.83.
[2] Using a normal distribution to calculate the problem of Dem margin ge 0.0000001 with mean equal to fundamentals value minus the average “miss” of 0.7 and a standard deviation of 11.19. There is a lot of “wobble” in these fundamentals margin estimates.


One thought on “A 2026 Election Forecasting Primer”