
In the Key 2026 Senate and Governor Elections tables displayed on my homepage, I present three scenarios for projected final Democratic margin: 1) polling averages systematically over-assess Democratic margins by four percentage points (“points”), 2) no systematic error in polling averages and 3) polling averages systematically under-assess Democratic margins by four points. Using colors to represent broad categories of win likelihood, I visually show uncertainty in these selected elections – essentially, projected Democratic margin plus/minus four.
As of this election cycle, meanwhile, I no longer adjust polls for bias resulting from the partisan/ideological leanings of a polling firm’s executives, something relatively easy to glean from a firm’s website. This is not the same as how much any polling firm, whether Democratic/progressive (“DEM”), neutral/bipartisan (“neutral”) or Republican /conservative (“GOP”), typically deviates from an election’s final Democratic margin. This is the potential partisan bias – and that of its preferred customer base – of the founders of the polling firm.
I first discussed this distinction late in the 2022 election season, when I warned that what looked like Republican gains in polling were simply an artifact of GOP pollsters releasing more polls. They seemed to be trying to “flood the market” with lower-quality polling, presumably to spook Democratic voters and rally Republican voters.
It was easy to dismiss firms like InsiderAdvantage, Quantus Insights and Trafalgar Group as hacks. That is, until the 2024 elections, when, as a group, GOP pollsters were by far the most accurate. They demonstrated what mainstream and Democratic pollsters could not – that enough Democrats would not vote while enough latent Republican voters would participate to reelect former Republican president Donald J. Trump and give Republicans a 53-47 Senate majority.
Going into the 2026 elections, then, I decided to adjust polls for time only, with increasing weight given to polls released after Labor Day, after October 1, etc. This means that I treat a poll conducted by InsiderAdvantage the same as one released by Emerson College (the most accurate neutral pollster over the last few cycles) and the same as one released by the most active DEM pollster this cycle, Change Research.
This raises an interesting question, though.
What would projected election results look like under three different scenarios: one using only GOP polls, one using only neutral polls and one using only DEM polls? The following scenarios use all publicly-released polls conducted between November 1, 2025 and October 25, 2026.
**********
We start with the generic ballot.[1] I excluded two generic ballot polls each from Angus Reid Global and Atlas Insights front this analysis because they are based outside the United States, making it difficult to judge their partisanship, if any, accurately.
In the last year, 413 polls have assessed the national partisan environment. Two-thirds of them (n=276) were conducted by neutral pollsters.[2] Their time-weighted average (“TWPA”) shows Democrats leading Republicans, 48.8% to 41.5%, or D+7.4. Assuming 1.6% of the electorate votes for a non-major-party House candidate (average over last four cycles), that leaves 8.1% of the electorate undecided.
A total of 104 generic ballot polls (25%), meanwhile, were conducted by GOP pollsters[3] over the last year. Their TWPA shows Democrats leading Republicans 48.2% to 41.8%, or D+6.4, with an estimated 8.3% of the electorate undecided.
Finally, only 29 generic ballot polls were conducted by DEM pollsters[4] over the last year, and only four since Labor Day. Their TWPA shows Democrats leading Republicans 48.3% to 41.2%, or D+7.1, with an estimate 8.9% undecided.
On the generic ballot, at least, there is only minimal difference between these three sets of pollsters. All three show a very Democratic electorate, ranging between D+6.4 and D+7.3. In 2024, Republican topped Democrats by 2.7 points in the total national vote for the House. Across these pollsters, Democrats are estimated to increase their margin by between 9.1 and 10.0 points. Using my model of vote change vs. seat change, I estimate Democrats will gain between 28 and 31 seats (+/-10) in the United States House of Representatives (“House”) in 2026, relative to the 215 seats Democrats held after the 2024 elections. For comparison, the current Kalshi projection is between 235 and 241 seats, or gains of 20 to 26, at the lower end of these estimates.
Figure 1: Trends in Democratic margin on the generic ballot since November 2025
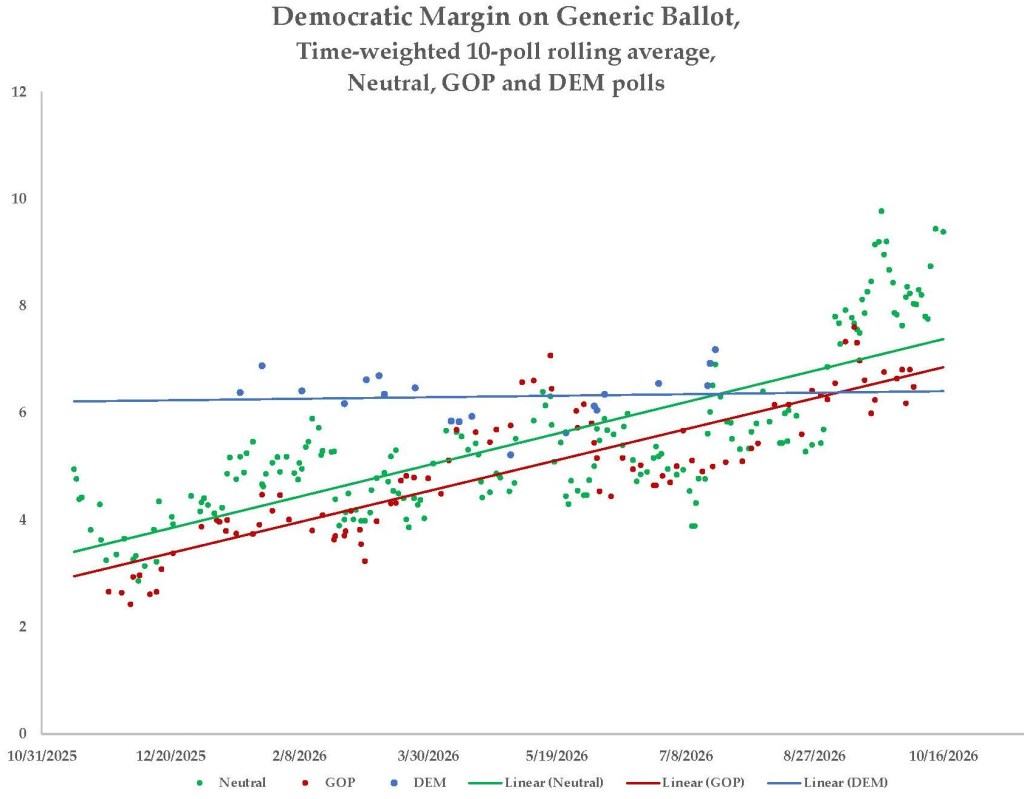
Meanwhile, Figure 1 shows that GOP and neutral pollsters assessed the same steady increase in the Democratic margin on the generic ballot since November 1, 2025, albeit with the neutral pollster consistently about 0.5 points higher. This is despite 17 of 52 neutral polls released since Labor Day showing Democrats with a double-digit lead, compared to just two of 20 GOP polls. The few DEM polls have closely hewed to a Democratic lead of around 6.2 points – the significantly higher weighting of the four post-Labor-Day polls (average margin = 7.5 points) pulls the TWPA up to 7.0 points.
**********
We next turn to the Senate, where 35 seats are in play. Democrats need to net at least four of them to regain the majority. Unfortunately, there are fewer of these polls per election, especially from DEM pollsters, meaning more projections will be based solely or mostly on historic trends. In fact, no pollster has yet assessed the Senate elections in Colorado, Delaware, New Jersey, Oregon, Virginia, West Virginia and Wyoming this cycle.
Figure 2: Distribution of Democratic Senate seats after 2026 elections, neutral pollsters only
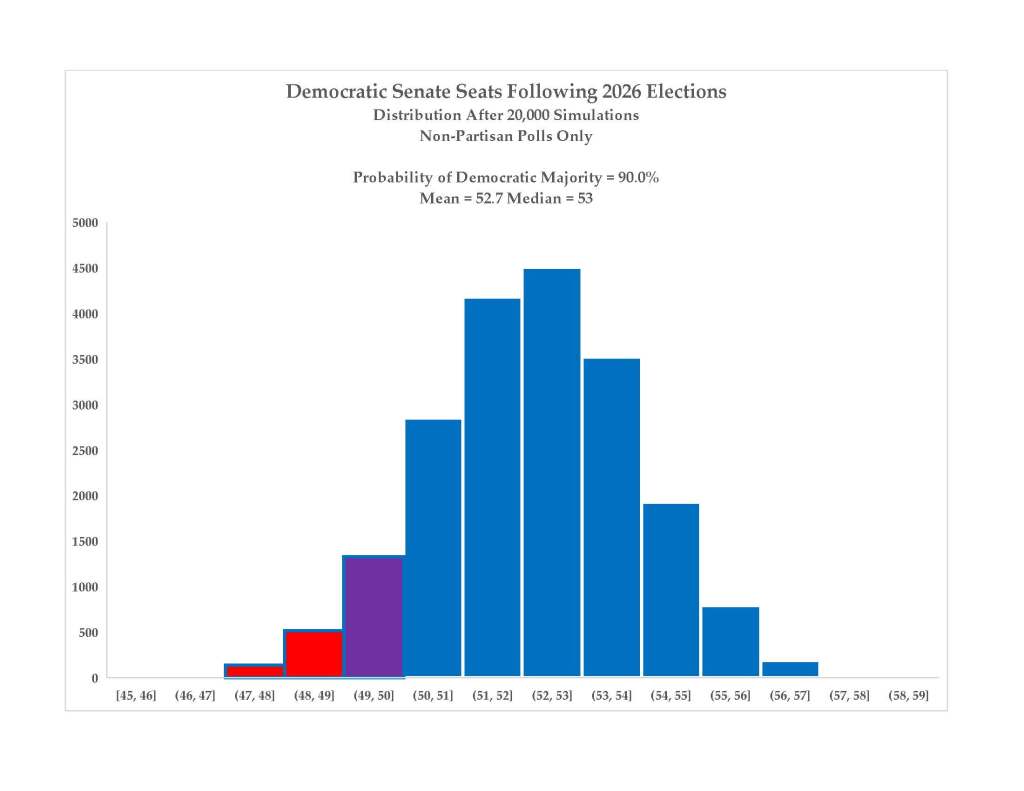
Neutral pollsters have conducted 204 polls of these elections, with at least 10 in Massachusetts (10), Maine (12), Alaska and Florida (13), Iowa and New Hampshire (14), Ohio (17), North Carolina (18), Michigan (20) and Texas (38). These 10 states account for 83% (n=169) of all neutral Senate polls this cycle. By contrast, besides the seven states listed above, neutral pollsters have yet to assess this year’s Senate elections in the seven states listed above plus Alabama, Louisiana, Mississippi, Oklahoma and South Carolina. Still, according to Figure 2 above, data from neutral pollsters only give Democrats a 90% chance to regain the Senate majority, with a median gain of six seats, two more than necessary.
Figure 3: Distribution of Democratic Senate seats after 2026 elections, GOP pollsters only
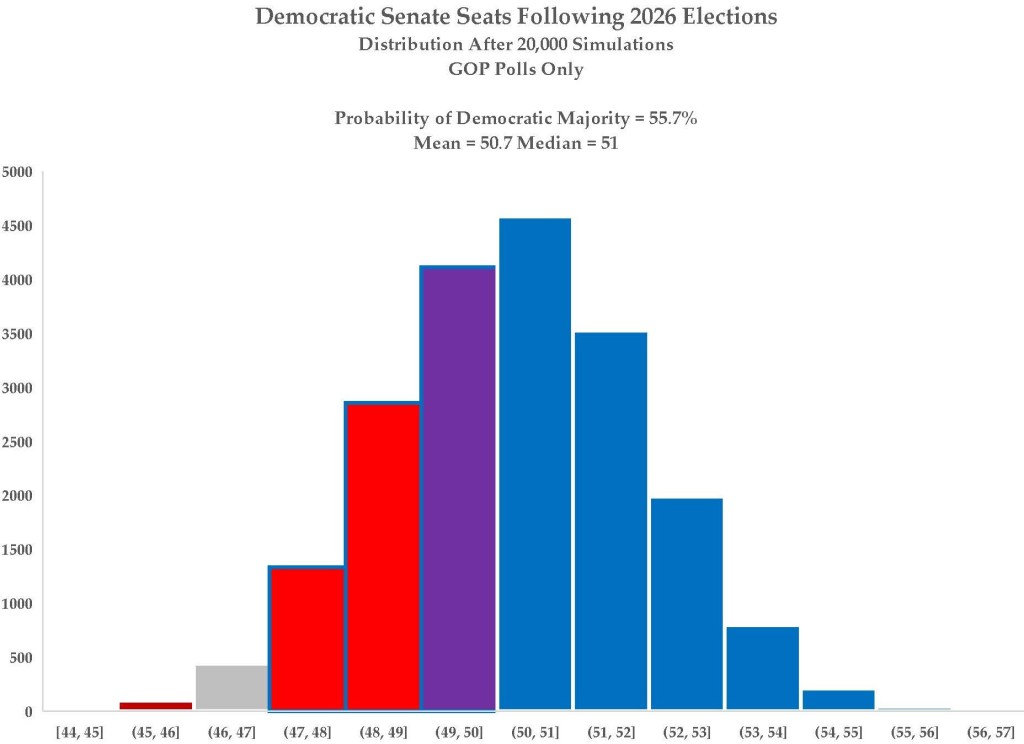
GOP pollsters, meanwhile, have conducted 161 Senate election polls this cycle, with at least 10 in Georgia (10), New Hampshire (11), Iowa and Ohio (12), North Carolina (15), Texas (19) and Michigan (24). These seven states account for 58% (n=93) of all GOP polls this cycle. By contrast, besides the seven states listed above, GOP pollsters have yet to assess this year’s Senate elections in Illinois, Kentucky, Louisiana, Mississippi, New Mexico, Rhode Island and Tennessee. Still, according to Figure 3 above, data from GOP pollsters only give Democrats a 56% chance to regain the Senate majority, with a median gain of four seats, precisely the number necessary.
Figure 4: Distribution of Democratic Senate seats after 2026 elections, DEM pollsters only
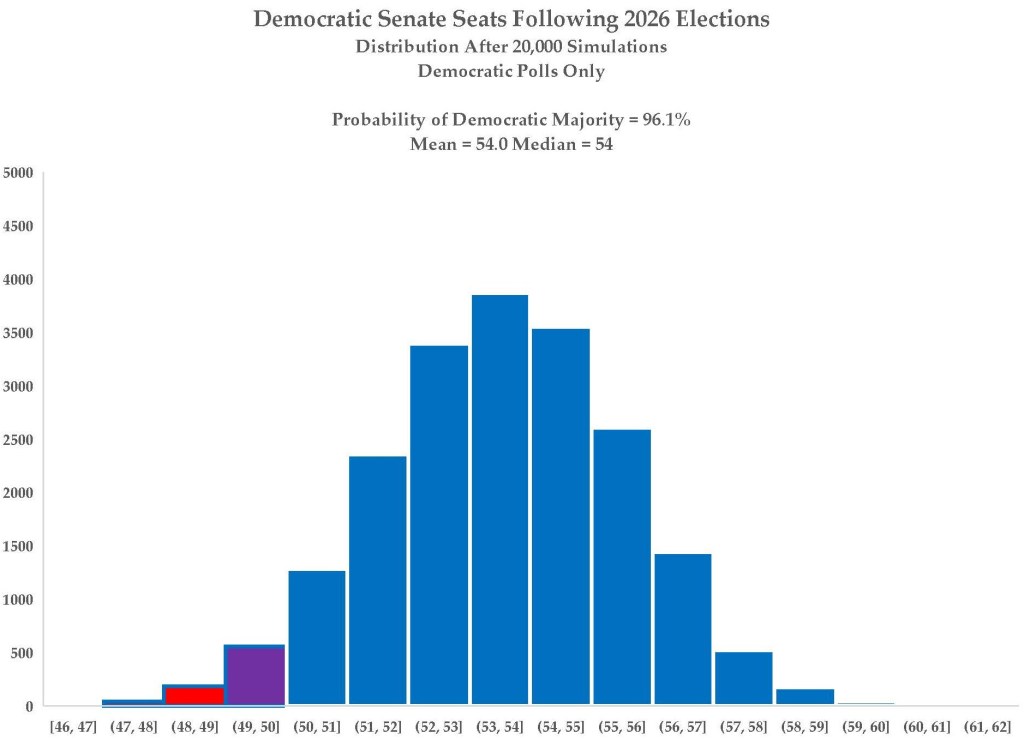
DEM pollsters, finally, have conducted 83 Senate election polls this cycle, with at least five in Michigan and South Dakota (5), Iowa and Kansas (6), Nebraska (7), North Carolina (9) and Texas (10). These seven states account for 58% (n=48) of all DEM Senate polls this cycle. By contrast, besides the seven states listed above, DEM pollsters have yet to assess this year’s Senate elections in Alabama, Georgia, New Hampshire, New Mexico, Oklahoma and Tennessee. Still, according to Figure 4 above, data from DEM pollsters only give Democrats a 96% chance to regain the Senate majority, with a median gain of seven seats, three more than necessary.
In short, even the GOP pollsters see Democrats as 5-4 favorites to regain a majority in the Senate, not far off from the Kalshi estimate of 63%, although the wesbite’s projected gain of five or six seats is closer to the assessments of neutral pollsters.
Table 1 lists the 15 Senate elections assessed at least three times by two or more sets of pollsters this cycle, plus Nebraska which was assessed twice by neutral and GOP pollsters. Values in italics indicate only two assessments. Color coding of states indicates whether the Democrat wins in all three scenarios, the Democrat wins in one or two scenarios, or the Democrat loses in all three scenarios. States in italics have not been assessed at all by one set of pollsters.
Table 1: Time-Weighted Polling Averages in Key Senate Elections by Pollster Type
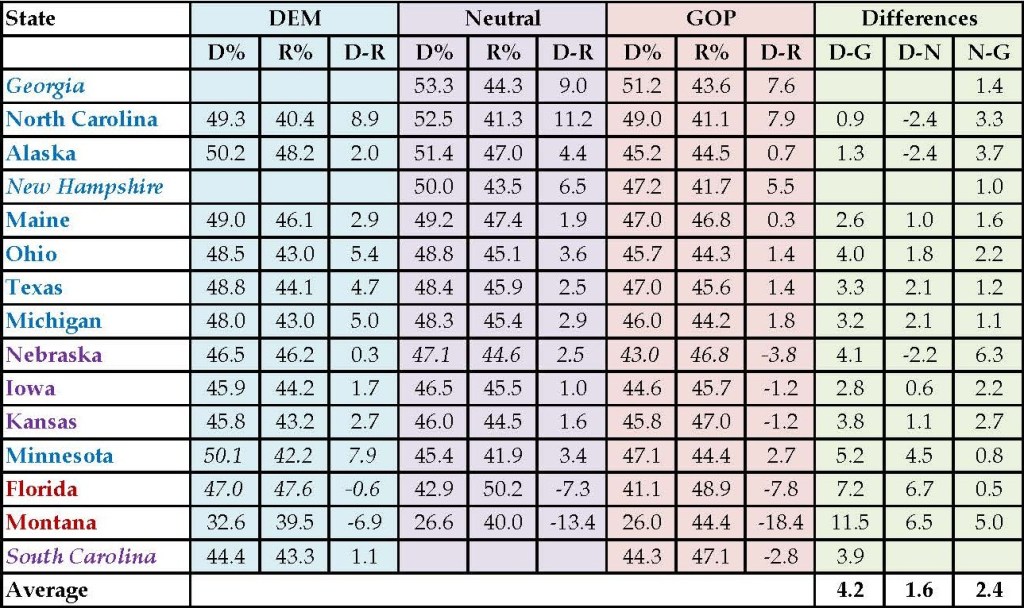
The primary takeaway from this table is that the Democratic Senate candidate leads in the polling average in every assessed scenario in enough states to net five seats, albeit narrowly in two instances. That is, Democrats appear poised to win every state they currently hold while flipping North Carolina, Alaska, Maine, Ohio and Texas. Next come Iowa, Kansas and Nebraska, in which the Democratic nominee (including Dan Osborne in Nebraska) leads in the DEM and neutral TWPA’s, but trail in the GOP TWPA. South Carolina has only been assessed by DEM and GOP pollsters, with Democrat Annie Andrews winning the former and losing the latter. Only Florida and Montana appear out of reach for Democrats, though if Alani Bankhead voters choose Independent Seth Bodnar instead, the latter election could be very close.
Not surprisingly, the DEM TWPA topped the GOP TWPA by an average of 4.2 points and topped the neutral TWPA by 1.6 points, while the neutral TWPA topped the GOP TWPA by 2.4 points. In essence, the DEM pollster scenario is the all-polls scenario on my home page plus about two points Democratic.
**********
This brings us to this cycle’s 36 gubernatorial elections. Democrats need to net at least two of them to have a majority for the first time since 2010. Again, though, there are fewer polls per election, especially from DEM pollsters, and many projections will be based solely or mostly on historic trends. In fact, no pollster has yet assessed the gubernatorial elections in Colorado, Hawaii and Wyoming this cycle.
Figure 5: Distribution of Democratic governors after 2026 elections, neutral pollsters only
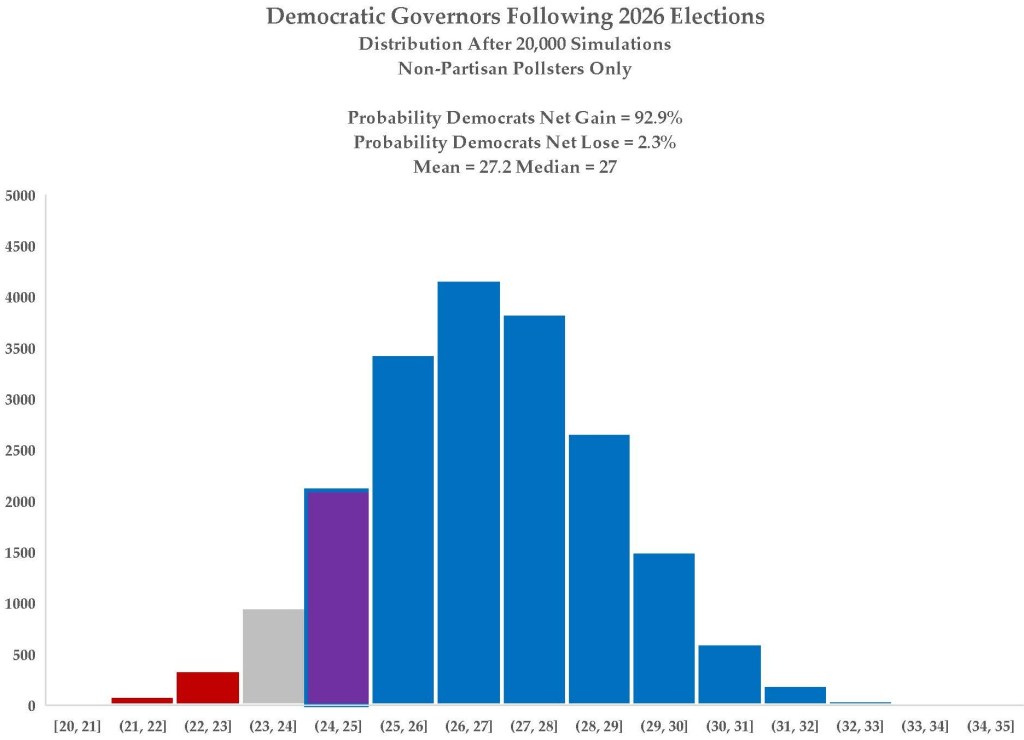
Neutral pollsters have conducted 250 gubernatorial election polls, with at least 10 in New Hampshire (11); California (13); Iowa (14); Florida, Maine and New York (15); Ohio (16), Pennsylvania (18), Michigan (21) and Texas (36). These 10 states account for 70% (n=174) of all neutral gubernatorial election polls this cycle. By contrast, besides the three states listed above, neutral pollsters have yet to assess this year’s gubernatorial elections in Alabama, Idaho, Illinois and South Carolina. Still, according to Figure 5 above, data from neutral pollsters only give Democrats a 93% chance to net at least one governor’s mansion, with a median gain of three, one more than necessary for a majority.
Figure 6: Distribution of Democratic governors after 2026 elections, GOP pollsters only
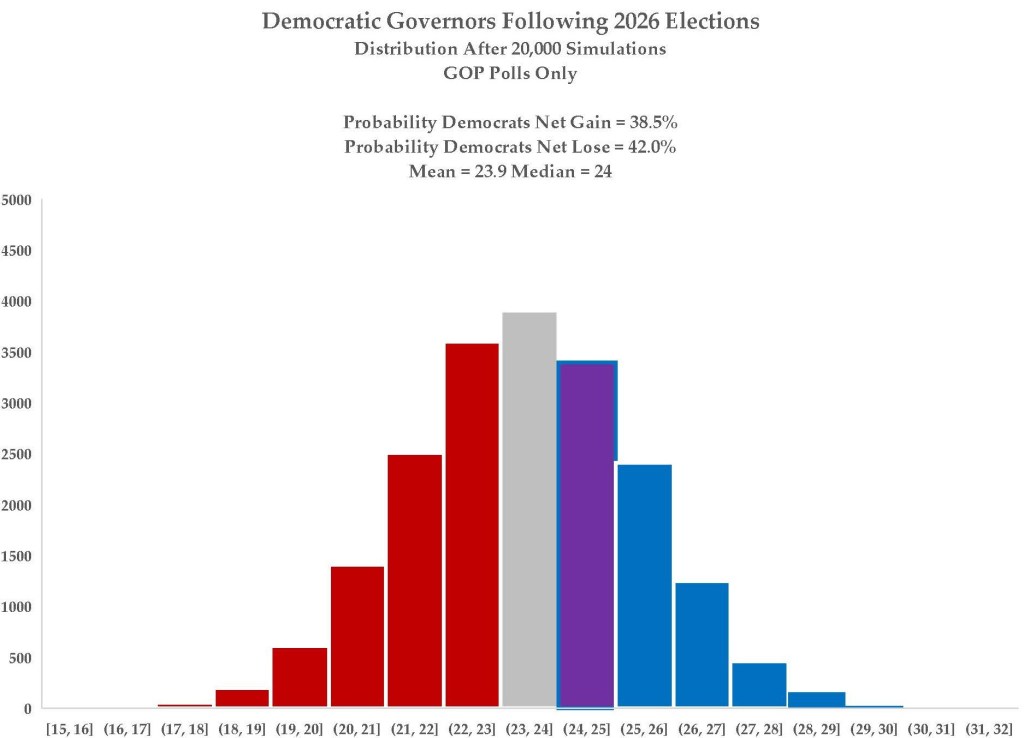
GOP pollsters, meanwhile, have conducted 92 gubernatorial election polls this cycle, with at least five in Alabama, Florida, Iowa and Ohio (5); Arizona, Georgia and Texas (7); New York (9) and Michigan (11). These nine states account for 66% (n=61) of all GOP gubernatorial election polls this cycle. By contrast, besides the three states listed above, GOP pollsters have yet to assess this year’s gubernatorial elections in Arkansas, Idaho, Illinois, Maryland, Massachusetts, Oklahoma, South Dakota and Vermont. Still, according to Figure 6 above, data from GOP pollsters only give Democrats just a 39% chance to net governor’s mansions – and a 42% chance of a net loss of governor’s mansions – with essentially status quo ante.
Figure 7: Distribution of Democratic governors after 2026 elections, DEM pollsters only
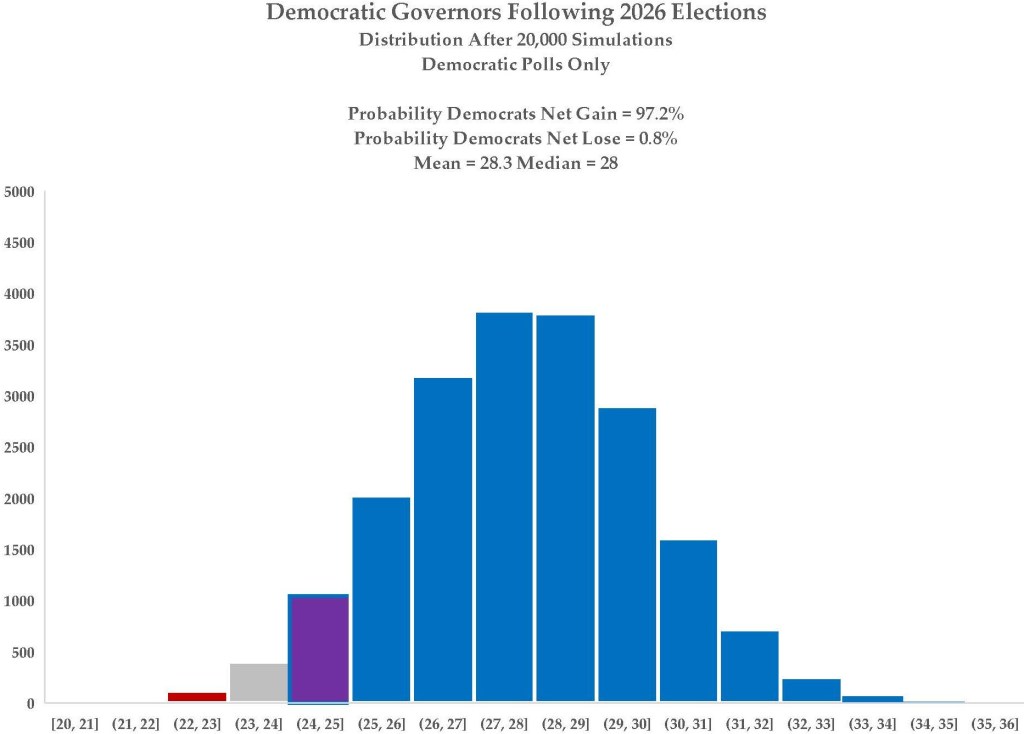
DEM pollsters, finally, have conducted 68 gubernatorial election polls this cycle, with at least four in Arizona, Nevada and Ohio (4); Nebraska (5); Florida (8) and Texas (11). These six states account for 53% (n=36) of all DEM gubernatorial election polls this cycle. By contrast, besides the three states listed above, DEM pollsters have yet to assess this year’s gubernatorial elections in Alabama, Arkansas, California, Maine, Minnesota, New Hampshire, Oklahoma, Tennessee and Vermont. Still, according to Figure 7 above, data from DEM pollsters only give Democrats a 97% chance to net governor’s mansions, with a median gain of four, two more than needed for a majority, and matching the current Kalshi totals.
Table 2 lists the 13 gubernatorial elections assessed at least three times by two or more sets of pollsters this cycle. Values in italics indicate only two assessments. Color coding of states indicates whether the Democrat wins in all three scenarios, the Democrat wins in one or two scenarios, or the Democrat loses in all three scenarios. States in italics were not assessed by one set of pollsters.
Table 2: Time-Weighted Polling Averages in Key Senate Elections by Pollster Type
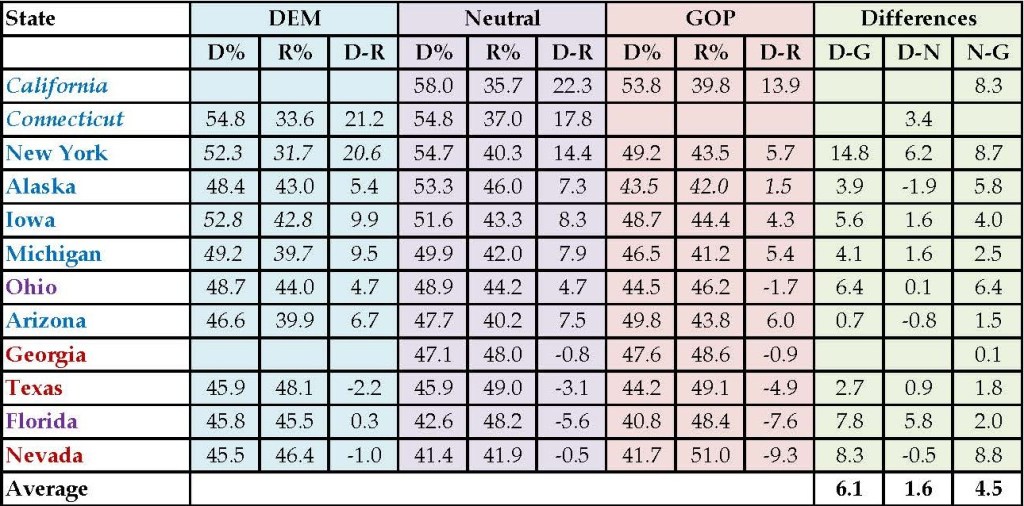
The primary takeaway from this table is that the Democratic gubernatorial candidate leads in the polling average in every assessed scenario in enough states to net one seat, assuming Republican Ty Masterson flips the governor’s mansion in Kansas. That is, Democrats appear poised to win every governor’s mansion they currently occupy, while flipping Iowa and Alaska. Democrat Amy Acton wins the governorship of Ohio in the DEM and neutral pollster scenarios, but loses more narrowly in the GOP pollster scenario. Democrat David Jolly barely wins the governorship of Florida in the DEM pollster scenario, but loses by mid-single-digits in the other two scenarios. Democrat Keisha Lance Bottoms narrowly loses the governorship of Georgia in the neutral and GOP pollster scenarios, although a late-May poll from the Democratic pollster Concord Public Opinion Partners had her winning by 15 points. Democrat Aaron Ford loses the governorship of Nevada narrowly in the Democratic and neutral pollster scenarios, while getting trounced in three GOP polls in July (three polls released after Labor Day have Ford down only 0.3 points). Finally, Democrat Gina Hinajosa loses the governorship of Texas in all three scenarios, albeit most narrowly in the Democratic pollster scenario.
Not surprisingly, the DEM TWPA topped the GOP TWPA by an average of 6.1 points and topped the neutral TWPA by 1.6 points, while the neutral TWPA topped the GOP TWPA by 4.5 points. In essence, the DEM pollster scenario is the all-polls scenario on my home page plus about four points.
**********
In total, since November 1, 2025, neutral pollsters have conducted a total of 730 generic ballot, Senate and governor polls, far more than the 357 conducted by GOP pollsters and 180 conducted by DEM pollsters. Outside of conducting the only publicly-released polls of the Louisiana and Mississippi Senate elections, Democratic pollsters simply have not yet come to play in the 2026 elections. This means that the typical polling average has twice as many GOP polls and DEM polls. On average over the three election types, DEM polls have an average Democratic margin 3.9 points higher than polls. If there were as many DEM polls as GOP polls – and each then comprised one-fourth of all polls – the average TWPA would theoretically increase by 3.9 divided by two, divided by two again, or about one point overall. This would be enough for Democrats to net as many as seven seats – adding Iowa and Kansas – while moving Georgia into the Democratic governor’s column, and possibly Nevada as well. It would also solidify Acton’s position in Ohio.
Of course, it is also possible that the GOP pollsters are once again correct, and there are once again more than enough unpolled Republican voters to make Senate control roughly 50-50 and keep Democrats to their current 24 governors, albeit with the Democrats easily winning back a majority in the House.
Is it also possible that the neutral pollsters have it exactly correct, and my home page all-polls analysis is the most prescient.
Like many political junkies, I have been following the early vote tallies on Professor Michael McDonald’s invaluable website, and I see many reasons to think the best estimate of what will happen on Election Day lies somewhere between the DEM and neutral pollster scenarios.
We will know for certain in eight days.
If you have not already done so, please vote early if you can. If not, please vote on Election Day itself. Your country and I thank you.
Until next time…and if you like what you read here, please consider making a donation. Thank you!
[1] Some variation of “If the election were held in your district today, would you vote for the Democratic candidate, the Republican candidate, some other candidate or are you uncertain?”
[2] ActiVote, AlphaROC, AP-NORC, Beacon Research/Shaw & Company Research, The Bullfinch Group, Centerline Research Strategy, Emerson College, Focaldata, Harris Poll, Hart Research Associates/Public Opinion Strategies, High Point University, Hofstra University, Ipsos, Marist College, Marquette University Law School, McCourtney Institute for Democracy, Morning Consult, Noble Predictive Insights, Pew Research Center, Public Religion Research Institute, Quinnipiac University, Siena College, SSRS, SurveyMonkey, Talker Research, TrueDot, University of Massachusetts at Lowell, Verasight, Yale Youth Poll, YouGov, Zogby Strategies.
[3] Big Data Poll, Cygnal, Echelon Insights, Fabrizio Ward, GrayHouse, The Honest Poll, J.L.Partners, Manhattan Institute, McLaughlin & Associates, Public Opinion Strategies, Quantus Insights, Rainey Center, Rasmussen Reports, Research Company, RMG Research, TIPP, The Winston Group
[4] Change Research, Clarity Campaign Labs, Data For Progress, GBAO, Global Strategy Group, Impact Research, Public Policy Polling, Survey 160


One thought on “Forecasting the 2026 Elections: Three Partisan Scenarios”