
Results are still being tabulated in the 2026 elections. As of 1 am EST on November 6, 2026, Democrats have regained the majority in the United States House of Representatives (“House”) and Senate, as well as a majority of governors for the first time since 2010. Democrats have thus far won 249 House seats and lead in enough uncalled elections to win 258. They held onto every Senate seat while flipping seven others. The Democratic nominee currently leads in Alaska and Missisippi. And there will be at least 28 Democratic governors – flipping five governor’s mansions – with the Democratic nominee currently leading in Alaska and Kansas.
Prior to Election Day, I conducted, wrote and published a series of analyses of the election data – mostly polling – in real time. This essay collects every pre-election analysis. A later essay will assess how will these analyses forecast final results.
**********
I began with “wicked early” looks here and here. I explained my forecasting methodology here. And I proposed three outcome scenarios here, including this graphic.
I also wrote short updates on my home page.
September 17, 2026: A spate of post-Labor-Day polls, many from Republican-leaning pollsters, has dropped the likelihood Democrats retake the Senate to 78.7% (Likely Democratic), with a median gain of 5 seats – 1 more than necessary. The current “tipping point” state – the state that gets Democrats to 51 seats when seats are ranked by Democratic win probability – is Maine. Jackson is a 61.9% favorite (Tilt Democratic) to unseat Collins, albeit by a narrow 0.6 points. Combined the tipping point probability with the overall forecast, I estimate Senate control Leans Democratic…though a systematic polling error of just 2 points Republican would net Democrats only 2 seats, two short of a majority.
In Minnesota, where Democratic Senator Tina Smith is retiring, Lieutenant Governor Peggy Flanagan is now projected to beat sports journalist Michelle Tafoya by just 3.7 ponts, well below the historic expectation of 10.8 points. This means a 4-point polling error favoring Republicans puts this seat in jeopardy. In this scenario, Democrats could net lose 1 seat.
The likelihood Democrats net governor’s mansions is now 75.1%…with a 56.0% chance of an outright majority. The median gain remains two. Oregon Democratic governor Tina Kotek is struggling in her rematch with Republican State Senator Christine Drazan. Kotek is still projected to win by 2.3 points because of a historic expectation of a 25-point victory. A similar scenario played out in 2022, when Kotek won by 3.5 points.
September 23, 2026: A round of strong Democratic polling pushes the likelihood Democrats have a Senate majority in January 2027 up to 82.5% (Likely Democratic), with a median gain of 5 seats – 1 more than necessary. The “tipping point” state is currently one of two Tilt Democratic seats : Alaska, where former Peltola has a 61.2% chance to defeat Sullivan, and Maine (see September 17 entry).
The probability Democrats net gain governor’s mansions – with a median of 2, which would given them a majority for the first time since 2010 – is also up to 77.2%. The probability Democrats net lose governor’s mansions drops to 10.5%.
September 25, 2026: New polls of the Louisiana Senate and Vermont gubernatorial elections put them back into the key race tables. For now, I remain skeptical Democrats will win either election.
September 26, 2026: I now assign 1/2 weight to polls of the Alaska Senate and gubernatorial elections which only report initial vote choice, not final preferences after reallocation of votes from the two trailing candidates. Three recent Republican-leaning polls (co/efficient, Rasmussen Reports, Trafalgar Group) show incumbent Republican Senator Sullivan defeating former Democratic House Member Mary Peltola by an average 44.9% to 43.5% in first-choice ballots, with 6.2% going to two other Republicans and 5.4% undecided. In the five previous polls, three from Alaska Survey Research, Peltola beats Sullivan 51.9% to 48.1% when all votes are reallocated. These two sets of polls are somewhat apples and oranges, but they imply Peltola would win 72.4% of the 11.6% undecided or selecting a different first choice. Even if Peltola wins 60% of these votes, she defeats Sullivan 50.5 to 49.5%. Making this change boosts Peltola’s win probability to 64.6%. Alaska is now the clear “tipping point” Senate election.
Meanwhile, recent polling of the Michigan gubernatorial election shows Democratic Secretary of State Jocelyn Benson leading Republican House Member John James “only” by low single digits, so the race moves back into the key governor elections table for now.
September 27, 2026: Two elections show signs of tightening in favor of Republicans. One is the gubernatorial election in Georgia, where three polls concducted since Labor Day give Republican businessman Rick Jackson an average 1.4-point lead over Democratic former Atlanta Mayor Keisha Lance Bottoms. Strong Democratic fundamentals still make Bottoms a narrow favorite. The second is the Maine Senate election, where five points conducted since Labor Day give Democratic former State Senate President Troy Jackson an average 0.3-point lead over incumbent Republican Senator Susan Collins. While Jackson still leads in the polling overall, Collins’ historic incumbency advantage will bring this election down to the wire.
October 4, 2026: Thirteen states have relatively competitive Senate and gubernatorial elections this year. In all but one state – Ohio, where both Democratic nominees average 48% in polling and lead by 3 to 4 points – one Republican nominee is polling noticeably higher. I call this the “Cornyn Republican effect,” after the Texas Senator who lost renomination to state Attorney General Ken Paxton in March. Thus, a substantial sliver of supporters of John Cornyn are happy to support Republican Governor Greg Abbott but will either sit out the Senate race or vote for Democrat James Talarico.
Current time-weighted polling averages give Republican Senatorial nominees the edge over their gubernatorial counterparts in Alaska, Florida, Iowa, Maine, Michigan and Minnesota (mean = +5.3 points). The reverse is true in Georgia, Kansas, Nebraska, New Hampshire, South Carolina and Texas (mean = +7.8 points). The gap in Ohio is a negligible 0.5 points. The largest gaps are in New Hampshire (18.2 points) and Maine (10.7 points), two New England states where independents comprise at least 1/3 of the electorate. Overall, the gap is 6.1 points, on average.
October 14, 2026: Following the example of FiftyPlusOne, I dropped seven polls released by The Public Sentiment Institute in 2026: 3 generic ballot, 2 Virginia Senate, 1 Florida governor, 1 Maine governor. And because YouGov conducted two polls of the Texas Senatorial and gubernatorial elections over the same time period (September 28 to October 5, 2026), I collapsed these into a single large poll (n=4,426). The impact on time-weighted polling averages (“TWPA”) from these changes was negligible.
Meanwhile, with 20 days remaining until Election Day, Democrats could lose two points in every TWPA and still net the four Senate seats they need to secure a majority as of January 2027. In this scenario, Democrats hold all of their seats while flipping North Carolina, Ohio, Alaska and Texas. Maine (R+0.1) would likely be decided by ranked choice voting. This polling “cushion” is one reason why my projections are very bullish on Democratic control of the Senate.
October 20, 2026: Three polls of dubious quality assessing the open gubernatorial election in Oklahoma were released in that last three weeks. While I am deeply skeptical Democratic State Representative Cindy Munson will defeat former Republican State Senator Mike Mazzei, the election has been added to the Key 2026 Governor Elections table, categorized as Likely Republican. The Democratic Governor’s Association announced it will invest $500,000 in this election.
Meanwhile, I deleted all Wedgewood Polls data following their brazen admission of fabricating data. The 17 polls included 2 Senate polls in Maine and Michigan, plus 1 each from Georgia, Iowa, Kansas, Mississippi, Nebraska and Texas, as well as 1 each in the gubernatorial elections in Georgia, Iowa, Kansas, Michigan, Nevada, Ohio and Texas. The projected margin in Mississippi jumped to 8 points Republican, so I removed it from the Key 2026 Senate Elections table. The gubernatorial election in Nebraska shifted from Likely to Leans Republican. Otherwise, the impact was negligible.
October 22, 2026: I removed the North Carolina and South Dakota Senate elections from the Key 2026 Senate Elections table. In the former state, former Democratic governor Roy Cooper is a near-lock (p=96.7%) to flip the seat held by retiring Republican Senator Thom Tillis. In the latter, new (Republican) polling now gives Independent Brian Bengs only a 4.2% chance to defeat incumbent Republican Senator Mike Rounds.
And, for now, the Michigan gubernatorial election is back in the Key 2026 Governor Elections table, albeit with a rating of Solid Democratic.
October 23, 2026: Thanks to a new poll showing incumbent Republican Senator Cindy Hyde-Smith 3 points ahead of District Attorney Scott Colom, Mississippi is now back in the Key 2026 Senate Elections table, classified as Leans Republican. The only three public-facing polls of this election were conducted by Democratic-leaning pollsters (Change Research, Data For Progress, Impact Research), so some caution is advised. Nonethless, this election is starting to receive national attention.
October 26, 2026: I took advantage of a slow polling weekend to finish examining a new way to understand the 2026 elections: examining only polls released by Democratic firms, by neutral firms and by Republican firms. I encourage you to read the full analysis, but the bottom line is this: my polling averages (TWPA) might be underestimating Democratic strength by about one point on average.
Moreover, even if you only looked at GOP polls, Democrats would still be 56% favorites to regain a Senate majority, with a net gain of four or five seats: Alaska, North Carolina, Ohio, Texas and, quite possibly, Maine.
October 27, 2026: A large batch of new polls from Democratic pollsters Concord Public Opinion Partners and RedBox Research improved the win probabilities of a number of Democratic candidates for Senate and governor, most notably in Nebraska, Nevada, Ohio and South Carolina, as you can see in the updated Key Election Tables.
October 29, 2026: I corrected color-coding errors in the Key Election Tables. The most notable changes are the Georgia and Nevada gubernatorial elections now being pure toss-ups – though the early vote looks very strong for Democrats in both states (Jon Ralstson’s analyses of Nevada early voting are essential), while the Minnesota Senate race and Wisconsin gubernatorial election look even better for Democrats. On the flip side, both the Senate and gubernatorial elections in Florida are looking safer for the Republicans.
November 3, 2026: Election Day 2026 has arrived!
The biannual “cheat sheet” is now available as a PDF. Sorted by the time all polls close in a state, it presents the candidates (party holding seat in italics, with incumbents underlined) plus a rough projection of the final Democratic margin. A reasonable rule of thumb is to allow for three points in either direction. Races projected to change partisan hands are colored in blue for Democratic gains – with one likely Repblican gain (Kansas governor), albeit this election is now a toss-up.
If every flip is correct, Democrats will keep every seat they currently have while adding seats in Alaska, Iowa, Kansas, Maine, North Carolina, Ohio and Texas – with Louisiana, Nebraska and South Carolina winnable if polls underestimate Democratic strength by about one percentage point. On the flip side, Democrats would still net the four seats needed to regain a Senate majority even if the polls are overestimating Democratic strength by 2.5 points. Put another way, even if 2/3 of all undecided voters choose the Republican ballot, Democrats would still regain a Senate majority, with a seat to spare.
Democrats also seem poised to lose the governor’s mansion in Kansas, while adding those in Alaska, Iowa and Ohio, with the ones in Georgia and Nevada balanced on a knife’s edge. This net gain of 2-4 seats would make a majority of governors Democrats for the first time since 2010.
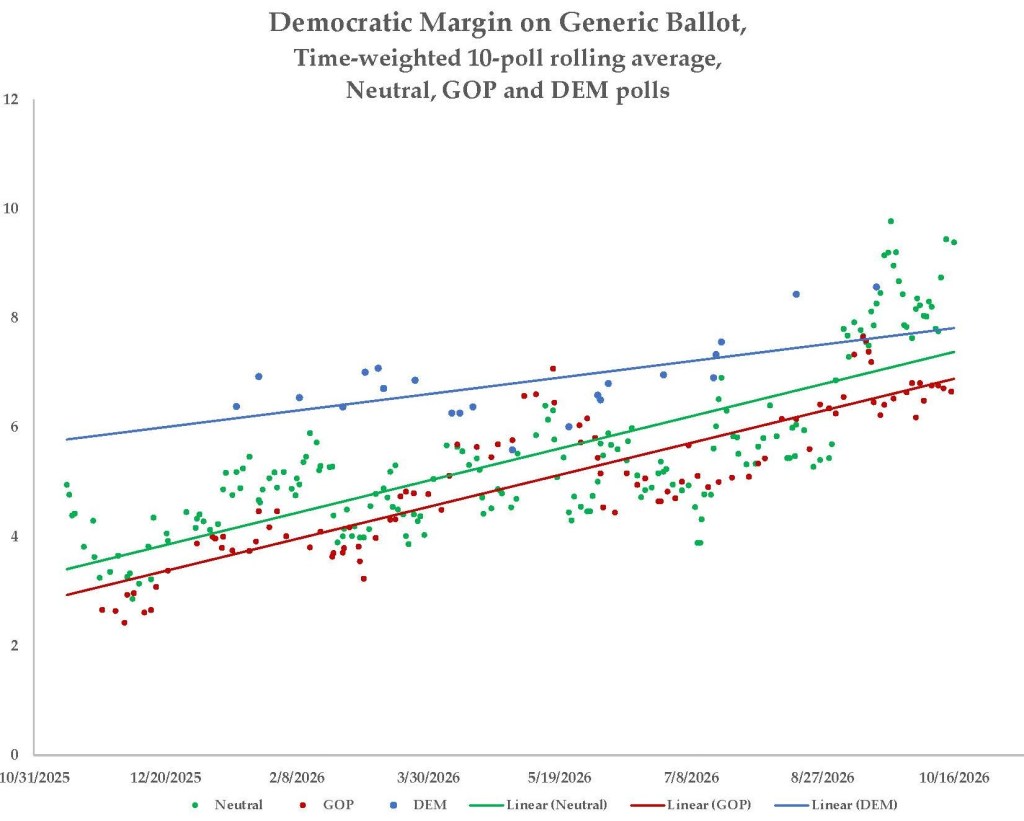
As for the House, Democratic strength on the generic ballot has been increasing steadily since November 2025, regardless of the partisan affiliation of the pollster. The final time-weighted polling average (“TWPA”) is Democrats plus 7.5, but I am being cautious and assuming 2/3 of undecided voters choose the Republican candidate. This would give Democrats a 5.2-point lead nationally – a 7.9-point improvement from both 2022 and 2024 – and an estimated gain of 15-33 seats, centered on 24. Democrats are thus projected to have between 230 and 248 House seats, well over the minimum 218 needed for a majority.
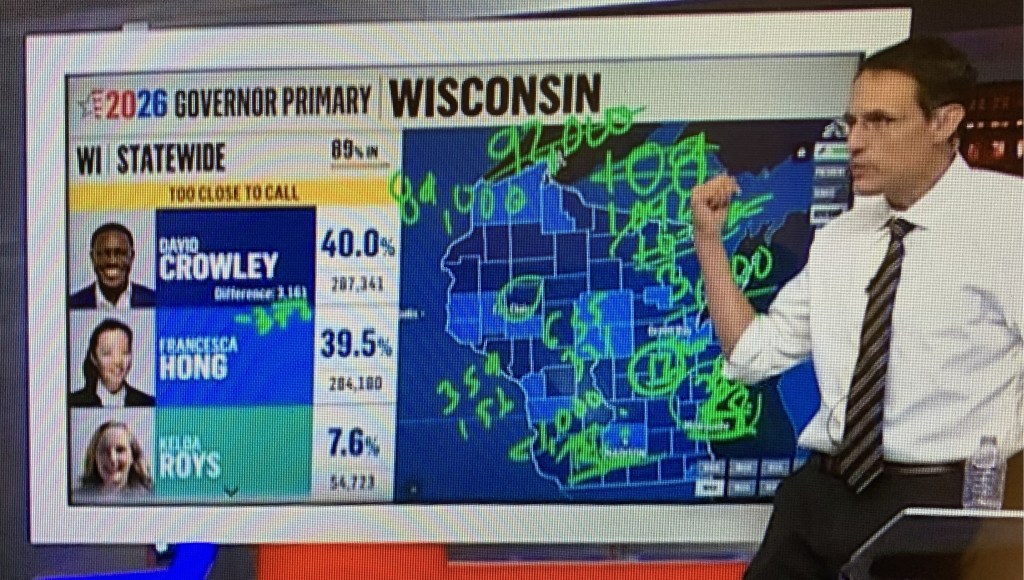
If you have not already done so, please vote. And then sit and enjoy the returns as they trickle in. I will be following Steve Kornacki, who produced this glorious piece of art earlier this year.
**********
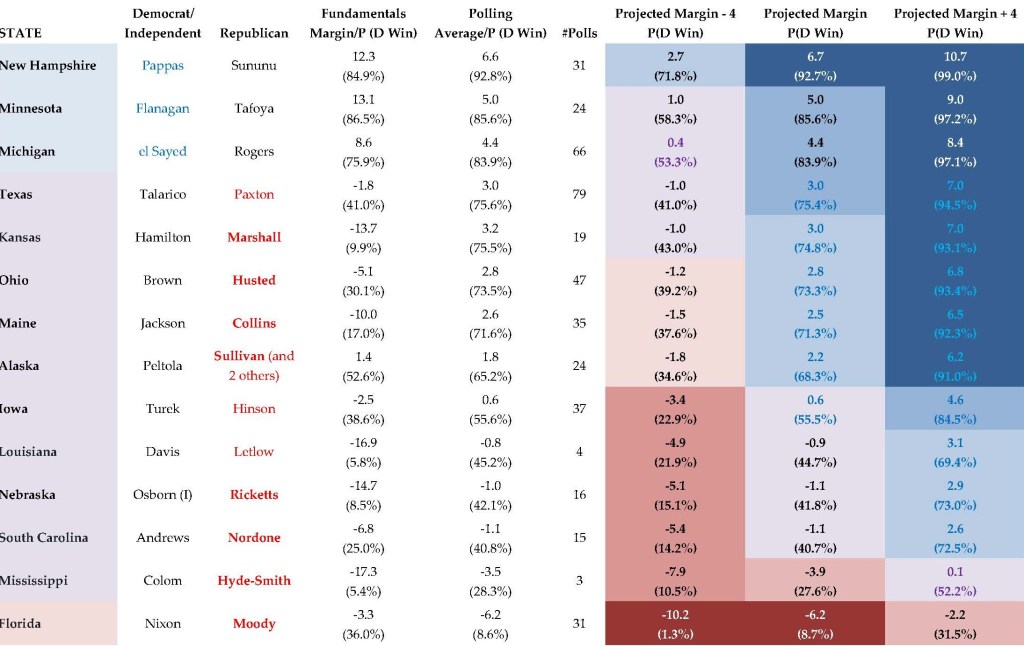
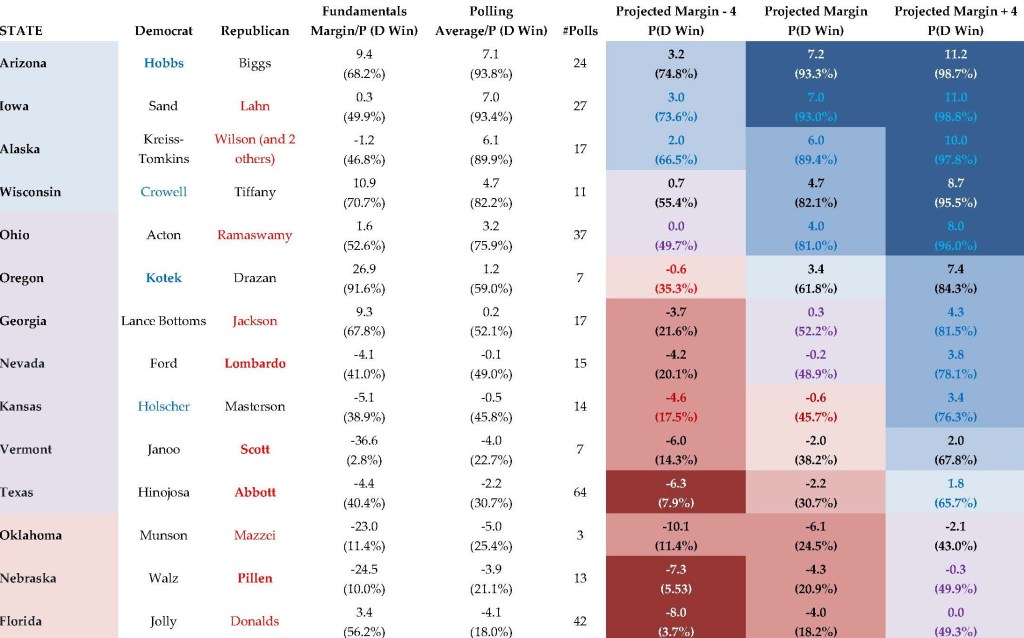
Color-coded tables displayed three scenarios – polls overestimate Democratic margins by four percentage points (“points”), margins are accurate, polls underestimate Democratic margins by four points – for elections with a projected final margin less than 7.5 points. The Georgia and North Carolina Senate races are Solid Democratic – with the latter a Democratic pick-up – so they are no longer in the table.
Shading blue, purple and red is Solid Democratic (probability of Democratic win >90%), Likely Democratic (75 – 90%), Leans Democratic (66 – 75%), Tilt Democratic (60 – 66%), Toss-up (40 – 60%), Tilt Republican (34 – 40%), Leans Republican (25 – 33%), Likely Republican (10 – 25%) and Solid Republican (<10%).
States where Democrats or Democratic-aligned independents win in each scenario are light blue, states where both parties win in at least one scenario are purple, and states where Republicans win in each scenario are red. Incumbents in boldface. Color indicates which party currently holds seat. Font color shows Democratic or Republican flips.
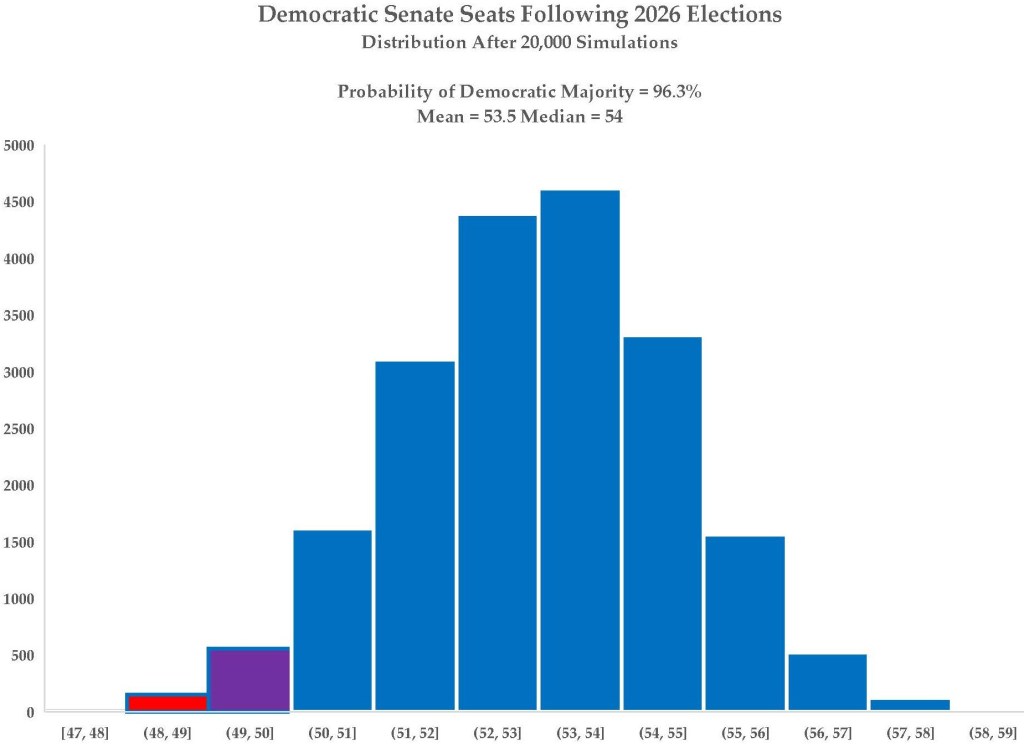
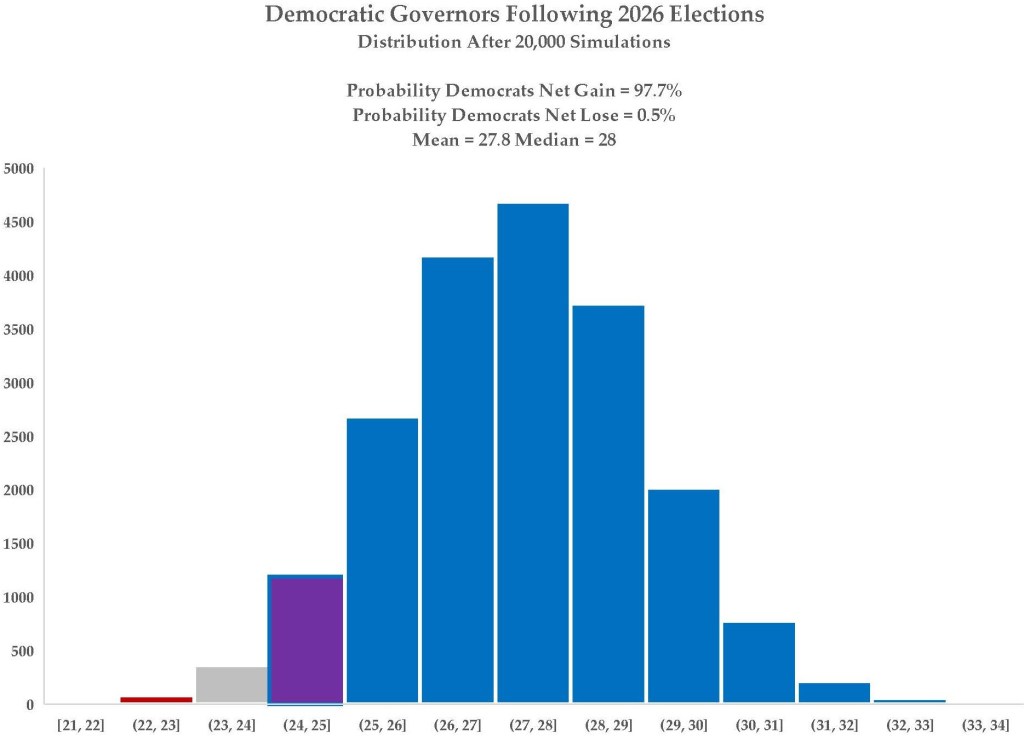
I was admittedly nervous about publishing these graphics showing Democrats essentially a lock to win a solid majority in the House and a smaller majority in the Senate – centered on 53-54 seats, while holding a majority of governor’s mansions – centered on 27-29 – for the first time in 16 years. For one thing, I did not account for the possibility of correlated error, meaning that if polls showing narrow margins were off by a few percentage points (“points”) in Ohio, they would be off in states like Michigan, Minnesota and Wisconsin, . Or if polls were off in Iowa, they would also be off in Kansas and Nebraska. Or if polls were off in Georgia, they would also be off in Louisana, Mississippi, North Carolina and South Carolina. If they were off in Arizona, they would also be off in New Mexico and Texas. Alaska and Florida? They are sui generis at this point. Given that my Democratic win probabilities in these states were based almost entirely on polling, this was an issue. Essentially, the distribution would not have been Normal, it would have been bimodal, with peaks around 47 and 57.
I also looked at Democratic win probablities in individual elections and thought a) the “tipping point” election for a Senate majority – Maine – was only 71%, while the tipping point election for a gubernatorial majority – Ohio (mooting a loss in Kansas) – was 81% and b) there are quite a few paths to Democratic majorities, even with some pro-Republican polling misses. This led me to ponder if I should somehow lower the probabilities in the graphics.
Thankfully, I chose to trust my instincts.
Until next time…and if you like what you read here, please consider making a donation. Thank you!


One thought on “Forecasting the 2026 Elections: Blog Entries and Graphics”