On November 3, 2020, the presidential election between incumbent Republican Donald J. Trump and his Democratic challenger, former Vice President Joseph R. Biden, Jr., will mark the end of a weeks-long electoral process. One month ago, I analyzed all publicly-available polls of the presidential election—nationally and by state, recognizing presidential elections are determined by the Electoral College—conducted since January 1, 2019.
Since then, Biden selected United States Senator Kamala Harris of California to be his vice-presidential running mate, as I anticipated, and both the Democrats and Republicans held mostly-virtual televised nomination conventions.
Did these events change the trajectory of this election?
The short answer is…no.
Table 1 lists the number of national polls assessing Biden vs. Trump conducted in 2019 and in each month of 2020; a handful of older polls were released since my last update. Sixty-five pollsters, with an average B- FiveThirtyEight pollster rating, have assessed the 2020 presidential election at least once since January 1, 2019; 45 of them (mean B-/B) have assessed the election more than once.
Table 1: Number of 2020 Monthly National Polls Assessing Biden vs. Trump
| Month | # Polls |
| All of 2019 | 107 |
| January 2020 | 20 |
| February 2020 | 25 |
| March 2020 | 35 |
| April 2020 | 50 |
| May 2020 | 48 |
| June 2020 | 62 |
| July 2020 | 51 |
| August 2020 | 73[1] |
| TOTAL | 471 |
Fifteen pollsters (mean B-) account for 70% of these polls, as well as 68% of the 364 polls conducted in 2020:
- YouGov (B-), 64 polls (49 in 2020)
- Morning Consult (B/C), 48 polls (43 in 2020)
- Ipsos (B-), 35 polls (28 in 2020)
- HarrisX (C), 27 polls (18 in 2020)
- Emerson College (B+), 19 polls (7 in 2020)
- Fox News (A-), 18 polls (9 in 2020)
- Change Research (C-), 16 polls (13 in 2020)
- RMG Research (B/C), 15 polls (15 in 2020)
- Data For Progress (B-), 14 polls (14 in 2020)
- Optimus (B/C), 14 polls (13 in 2020)
- IBD/TIPP (A/B), 14 polls (9 in 2020)
- Rasmussen Reports/Pulse Opinion Research (C+), 13 polls (10 in 2020)
- Quinnipiac University (B+), 11 polls (7 in 2020)
- Zogby Interactive/JV Analytics (C+), 11 polls (6 in 2020)
- CNN/SSRS (B/C), 10 polls (7 in 2020)
Figure 1 shows how Biden has fared monthly against Trump in 2020, using my weighted-adjusted polling averages (WAPA). I use pollster rating data to adjust for partisan lean (historic tendency to err more Democratic or Republican than other pollsters in analogous races) and quality. I weight more recent polls higher, using this ratio: number of days since January 1, 2019 divided by 673, the number of days between January 1, 2019 and November 3, 2020. I then average two versions of WAPA: one treating polls by the same pollster as statistically independent, and one treating all polls by the same pollster as a single, time-weighted value; differences between estimates are usually negligible.
Figure 1

Using all polls conducted since January 1, 2019, Biden leads Trump nationally by 7.5 percentage points (“points”). Biden’s margin rose from just over four percentage points in January and February, when he was fighting for the 2020 Democratic presidential nomination, to just under six points in the three months after Biden’s decisive win in the 2020 South Carolina Democratic presidential primary, to between eight and nine points since June 1, the day protesters were forcibly cleared from Lafayette Square so Trump could pose in front of St. John’s Episcopal Church holding a copy of the Bible.
**********
Again, though, presidential elections are fought across 50 states and the District of Columbia (“DC”), with the plurality winner in each state/DC winning every electoral vote (“EV”) from that state. Table 2 lists the number of polls within each state assessing Biden vs. Trump since January 1, 2019, plus that state’s 3W-RDM, my estimate of much more or less Democratic than the nation a state has voted over the last three presidential elections; eight states[2] and DC have not been polled.
Table 2: Number of state-level polls assessing Biden vs. Trump since January 1, 2019
| State | 3W-RDM | Overall | 2020 |
| Michigan | 2.2 | 75 | 61 |
| Wisconsin | 0.7 | 73 | 60 |
| North Carolina | -6.0 | 69 | 56 |
| Pennsylvania | -0.4 | 62 | 53 |
| Florida | -3.4 | 53 | 45 |
| Arizona | -9.7 | 52 | 44 |
| Texas | -15.3 | 48 | 33 |
| Georgia | -9.6 | 31 | 26 |
| Ohio | -5.8 | 20 | 16 |
| California | 23.2 | 20 | 14 |
| Iowa | -4.7 | 20 | 13 |
| New Hampshire | 0.1 | 15 | 10 |
| Minnesota | 1.5 | 14 | 13 |
| Colorado | 2.2 | 12 | 10 |
| Virginia | 1.5 | 12 | 8 |
| Kentucky | -28.7 | 11 | 9 |
| Maine | 5.9 | 11 | 8 |
| Montana | -18.6 | 10 | 9 |
| South Carolina | -15.7 | 10 | 8 |
| Missouri | -15.9 | 9 | 7 |
| Massachusetts | 22.1 | 8 | 7 |
| Nevada | 2.0 | 8 | 4 |
| New York | 21.6 | 7 | 7 |
| Utah | -33.1 | 7 | 6 |
| Washington | 12.1 | 7 | 5 |
| New Jersey | 12.0 | 6 | 6 |
| Connecticut | 12.8 | 6 | 4 |
| Alabama | -28.4 | 5 | 5 |
| Kansas | -23.4 | 5 | 5 |
| Mississippi | -18.5 | 4 | 4 |
| Oklahoma | -38.1 | 4 | 4 |
| Alaska | -19.2 | 4 | 3 |
| North Dakota | -29.4 | 4 | 2 |
| New Mexico | 6.5 | 3 | 3 |
| Tennessee | -25.8 | 3 | 3 |
| Indiana | -16.3 | 3 | 3 |
| Maryland | 22.6 | 2 | 2 |
| Delaware | 12.5 | 2 | 2 |
| Arkansas | -28.2 | 1 | 1 |
| Hawaii | 34.3 | 1 | 1 |
| Louisiana | -22.2 | 1 | 1 |
| West Virginia | -35.5 | 1 | 1 |
| TOTAL | D-6.1 | 719 | 582 |
Nineteen states have been polled at least 10 times since January 1, 2019, of which 14 have been polled at least 10 times in 2020. Four of the top five, along with suddenly-swing North Carolina, are the closest states won by Trump in 2016: Michigan, Wisconsin, Pennsylvania, Florida. Five other Republican-leaning states have been frequently polled: Arizona, Georgia, Texas, Ohio and Iowa, reflecting their status as ongoing or emerging battlegrounds. California, with 54 EV, rounds out the 11 states polled at least 20 times overall.
National averages still matter, though. Combined with 3W-RDM, they provide the “expected Democratic-minus-Republican margin” in each state in 2020, all else being equal. For example, North Carolina has recently been 6.0 points less Democratic than the nation as a whole. Adding that to Biden’s current national margin (-6.0 +7.5 = +1.5) suggests Biden is slightly favored to win North Carolina in 2020, based solely on its recent voting history. Indeed, Biden leads Trump by an adjusted mean of 1.9 points in 52 polls conducted in North Carolina. Table 3 lists every state’s expected value and WAPA.
Table 3: Expected and actual polling margins for Biden over Trump in each state in November 2020
| State | 3W-RDM | Expected | WAPA | WAPA-Expected |
| DC | 82.0 | 89.5 | ||
| Hawaii | 34.3 | 41.8 | 29.1 | -12.7 |
| Vermont | 27.7 | 35.2 | ||
| California | 23.2 | 32.7 | 28.4 | -2.3 |
| Maryland | 22.6 | 30.1 | 24.6 | -5.5 |
| Massachusetts | 22.1 | 29.6 | 34.3 | 4.7 |
| New York | 21.6 | 29.1 | 25.9 | -3.2 |
| Rhode Island | 18.0 | 25.5 | ||
| Illinois | 14.7 | 22.2 | ||
| Connecticut | 12.8 | 20.3 | 17.9 | -2.4 |
| Delaware | 12.5 | 22.0 | 19.2 | -0.8 |
| Washington | 12.1 | 19.6 | 24.6 | 5.1 |
| New Jersey | 12.0 | 19.5 | 18.2 | -1.3 |
| Oregon | 8.7 | 16.2 | ||
| New Mexico | 6.5 | 14.0 | 11.3 | -2.7 |
| Maine | 5.9 | 13.4 | 10.4 | -3.0 |
| Michigan | 2.2 | 9.7 | 7.0 | -2.7 |
| Colorado | 2.2 | 9.7 | 12.1 | 2.5 |
| Nevada | 2.0 | 9.5 | 3.8 | -5.7 |
| Minnesota | 1.5 | 9.0 | 7.7 | -1.3 |
| Virginia | 1.5 | 9.0 | 9.6 | 0.6 |
| Wisconsin | 0.7 | 8.2 | 5.0 | -3.2 |
| New Hampshire | 0.1 | 7.6 | 5.2 | -2.4 |
| Pennsylvania | -0.4 | 8.1 | 5.1 | -2.0 |
| Florida | -3.4 | 4.1 | 3.9 | -0.2 |
| Iowa | -4.7 | 2.8 | -1.6 | -4.4 |
| Ohio | -5.8 | 1.7 | 0.4 | -1.3 |
| North Carolina | -6.0 | 1.5 | 1.9 | 0.4 |
| Georgia | -9.6 | -2.1 | -0.7 | 1.3 |
| Arizona | -9.7 | -2.2 | 2.9 | 5.1 |
| Texas | -15.3 | -7.8 | -2.0 | 5.7 |
| South Carolina | -15.7 | -8.2 | -7.3 | 0.9 |
| Missouri | -15.9 | -8.4 | -6.3 | 2.2 |
| Indiana | -16.3 | -8.8 | -13.9 | -5.2 |
| Mississippi | -18.5 | -11.0 | -11.9 | -0.9 |
| Montana | -18.6 | -11.1 | -8.9 | 2.2 |
| Alaska | -19.2 | -11.7 | -4.3 | 7.3 |
| Louisiana | -22.2 | -14.7 | -11.2 | 3.5 |
| Kansas | -23.4 | -15.9 | -9.3 | 6.7 |
| Nebraska | -25.8 | -18.3 | ||
| South Dakota | -25.8 | -18.3 | ||
| Tennessee | -25.8 | -18.3 | -14.5 | 3.9 |
| Arkansas | -28.2 | -20.7 | -3.5 | 17.2 |
| Alabama | -28.4 | -20.9 | -18.2 | 2.7 |
| Kentucky | -28.7 | -21.2 | -17.0 | 4.2 |
| North Dakota | -29.4 | -21.9 | -20.4 | 1.5 |
| Utah | -33.1 | -25.6 | -13.1 | 12.5 |
| Idaho | -34.2 | -26.7 | ||
| West Virginia | -35.5 | -28.0 | -34.3 | -6.3 |
| Oklahoma | -38.1 | -30.6 | -23.0 | 7.7 |
| Wyoming | -45.7 | -38.2 | ||
| Average | D-6.4 | Biden+1.5* | Biden+2.1 | +0.7 |
* Only for the 42 states with both measures
The correlation between the expected margin and WAPA is +0.961, meaning polling matches expectations extremely well—as one increases or decreases, so does the other. Still, Biden is polling slightly ahead of those fundamentals, meaning state-level polling as a whole is even better for Biden than his excellent national polling; that said, the difference vanishes once you adjust for a state’s 2016 presidential election turnout.[3]
Biden is underperforming expectations in some states, most notably Hawaii—the birthplace of former President Barack Obama, artificially inflating Hawaii’s Democratic vote margin in 2008 and 2012. He is also underperforming in woefully-under-polled Nevada. Biden leads there by 3.8 points, nearly six points lower than the 9.5 points by which he “should” be leading. Biden is also underperforming expectations in very Democratic Maryland (-5.5) and Republican-leaning Iowa (-4.4). By the same token, Biden is overperforming in the traditionally Republican states of Arkansas, Utah, Oklahoma, Alaska, Texas and Kansas, as well as in reliably-Democratic Washington. There is a partisan split in Biden’s over-and under-performance: in states with 3W-RDM>-5.0, Biden is underperforming by 2.2 points, on average. In states with 3W-RDM≤5.0, Biden is overperforming by 3.4 points. Many grains of salt are in order here, though. In recent elections, “fundamentals” have missed the final margin by an absolute value average of 5.4 points.
Still, the close alignment between the two values allows us to combine them into a single estimate of Biden’s margin over Trump on November 3, 2020, assuming polls become more predictive as an election gets closer:
- Assign expected value and WAPA equal weight as of January 1, 2020.
- WAPA weight increases daily with proximity to November 3, 2020.
I also calculated how likely Biden is to win the EV from each state, assuming this likelihood is distributed normally:
- For expected margins, I use mean = -0.8 and standard error = 7.1[4]
- For WAPA, I use standard error = 3.0, roughly the margin of error in most quality polls; this is likely an over-estimate, as pooling reduces the standard error of the resulting polling average.
- Combined probability Biden wins a state’s EV calculated the same as for predicted final margin
While the means and standard errors I use are arguably arbitrary, albeit defensible, the final EV probabilities shown in Table 4 are in line with what other forecasters are saying.
Table 4: Estimated final state margins and probability of winning EV, Biden vs. Trump, November 2020
| State | EV | P(EV): Expected | P(EV): WAPA | P(EV): Overall | Predicted Margin |
| DC | 3 | 100.0% | 100.0% | 89.5 | |
| Hawaii | 4 | 100.0% | 100.0% | 100.0% | 31.1 |
| Vermont | 3 | 100.0% | 100.0% | 35.2 | |
| California | 55 | 100.0% | 100.0% | 100.0% | 28.7 |
| Maryland | 10 | 100.0% | 100.0% | 100.0% | 26.1 |
| Massachusetts | 11 | 100.0% | 100.0% | 100.0% | 33.8 |
| New York | 29 | 100.0% | 100.0% | 100.0% | 26.3 |
| Rhode Island | 4 | 100.0% | 100.0% | 25.5 | |
| Illinois | 20 | 99.9% | 99.9% | 22.2 | |
| Connecticut | 7 | 99.7% | 100.0% | 99.9% | 19.1 |
| Delaware | 3 | 99.7% | 100.0% | 100.0% | 19.6 |
| Washington | 12 | 99.6% | 100.0% | 99.9% | 22.1 |
| New Jersey | 14 | 99.6% | 100.0% | 99.9% | 18.8 |
| Oregon | 7 | 98.5% | 98.5% | 16.2 | |
| New Mexico | 5 | 96.8% | 100.0% | 99.3% | 11.9 |
| Maine | 4 | 96.2% | 100.0% | 99.4% | 10.9 |
| Michigan | 16 | 89.6% | 99.0% | 98.0% | 7.3 |
| Colorado | 9 | 89.5% | 100.0% | 98.8% | 11.9 |
| Nevada | 6 | 88.9% | 89.5% | 89.4% | 4.4 |
| Minnesota | 10 | 87.6% | 99.5% | 98.3% | 7.9 |
| Virginia | 13 | 87.5% | 99.9% | 98.3% | 9.5 |
| Wisconsin | 10 | 85.2% | 95.2% | 94.2% | 5.3 |
| New Hampshire | 4 | 83.1% | 96.0% | 94.3% | 5.5 |
| Pennsylvania | 20 | 81.3% | 95.5% | 94.0% | 5.3 |
| Florida | 29 | 68.0% | 90.5% | 88.1% | 4.0 |
| Iowa | 6 | 61.0% | 29.6% | 34.4% | -0.9 |
| Ohio | 18 | 54.9% | 55.7% | 55.6% | 0.6 |
| North Carolina | 15 | 54.0% | 73.6% | 71.6% | 1.9 |
| Georgia | 16 | 34.4% | 40.7% | 40.1% | -0.8 |
| Arizona | 11 | 33.6% | 83.6% | 78.4% | 2.4 |
| Texas | 38 | 11.4% | 24.9% | 23.4% | -2.7 |
| South Carolina | 9 | 10.4% | 0.8% | 2.2% | -7.4 |
| Missouri | 10 | 9.7% | 1.8% | 2.7% | -6.5 |
| Indiana | 11 | 8.9% | 0.0% | 1.4% | -13.1 |
| Mississippi | 6 | 4.9% | 0.0% | 0.7% | -11.8 |
| Montana | 3 | 4.7% | 0.2% | 0.7% | -9.1 |
| Alaska | 3 | 4.0% | 7.4% | 6.9% | -5.5 |
| Louisiana | 8 | 1.5% | 0.0% | 0.2% | -11.7 |
| Kansas | 6 | 0.9% | 0.1% | 0.2% | -12.6 |
| Nebraska | 5 | 0.4% | 0.4% | -18.3 | |
| South Dakota | 3 | 0.4% | 0.4% | -18.3 | |
| Tennessee | 11 | 0.4% | 0.0% | 0.2% | -16.4 |
| Arkansas | 6 | 0.1% | 12.2% | 9.3% | -12.1 |
| Alabama | 9 | 0.1% | 0.0% | 0.0% | -19.5 |
| Kentucky | 8 | 0.1% | 0.0% | 0.1% | -20.8 |
| North Dakota | 3 | 0.1% | 0.0% | 0.0% | -21.0 |
| Utah | 6 | 0.0% | 0.0% | 0.0% | -15.1 |
| Idaho | 4 | 0.0% | 0.0% | -26.7 | |
| West Virginia | 5 | 0.0% | 0.0% | 0.0% | -31.2 |
| Oklahoma | 7 | 0.0% | 0.0% | 0.0% | -26.8 |
| Wyoming | 3 | 0.0% | 0.0% | -38.2 |
- He is at least an 88.1% favorite in enough states—and by margins of at least four points—to earn him 308 EV, or 307 depending on what happens in Maine, which, along with Nebraska, allocates two EV to the statewide winner and one each to the winner of its Congressional districts. Moreover, Biden could lose Florida (+4.0, 88.1%), Nevada (+4.4, 89.4%) and one EV in Maine and still win 272 EV, two more than he needs.
- He is a 70-75% favorite to win in Arizona (+2.4) and North Carolina (+1.9), for an additional 26 EV, increasing Biden’s total to 333/334 EV.
- The 34 combined EV of Ohio (+0.6) and Georgia (-0.8) are essentially toss-ups, meaning Biden has a roughly 73% chance to win at least one of them, putting him somewhere between 349 and 352 EV, with a maximum of 368 EV (or 369 with one EV in Nebraska).
Three months before Election Day 2020, and with every caveat about voting during a pandemic, Joe Biden is the strong favorite to be elected the 46th president of the United States.
Plus, it might take only a sharp break by undecided voters and a modest polling error for Biden to win the 44 combined EV of Iowa (-0.9) and the ultimate prize—Texas (-2.7). Thus, while something in the low-to-mid 300’s currently appears the most likely EV total for Biden, 413 EV cannot be discounted.
Using the simplistic—perhaps even simple-minded—method of multiplying Biden’s probability of winning each state by its EV and summing yields a “projected” EV total of 349.2, essentially adding Michigan, Pennsylvania, Wisconsin, Florida, Arizona, North Carolina, and one of Ohio/Georgia to the states 2016 Democratic presidential nominee Hillary Clinton won.
Biden’s lead looks even more robust when you make either of two historically-valid assumptions:
Polls systematically overestimate Biden’s margins by 3.0 points.
In this scenario, Biden’s projected EV drops to 301.2, still 31.2 more than required. He would be favored at least 80% to win in enough states to win 239 EV, though he would also be favored by at least 74.6% in three states totaling 34 EV, getting him to 273 EV. Thus, even if Biden “only” wins the national popular vote by 4.2, he would likely still prevail, though the decisive states—some combination of New Hampshire, Pennsylvania and Wisconsin—would be decided by narrow margins, with all votes possibly not counted for a week or more.
Polls systematically underestimate Biden’s margins by 3.0 points.
In this scenario, Biden’s projected EV are a landslide-level 389.4, 119.4 more than necessary. He would be favored at least 80% to win enough states to earn 352 EV, while being a 74.9% favorite in Georgia, for a total of 368 EV. He would also be a 69.1% favorite in Iowa, with Texas now a toss-up at 58.1%–and a projected Biden victory of 0.3 points! Based on only one poll, Biden would have a 33.2% chance of winning Arkansas’ 6 EV, plus a 14.3% chance of winning Missouri’s 10 EV and a 11.5% chance of winning Alaska’s 3 EV. The last presidential candidate to come close to 433 EV was Republican George H. W. Bush, who won 426 EV in 1988.
**********
To maximize the number of polls available for analysis, I use all polls going back to January 1, 2019; I also use a straightforward time-weighting method: increasing the weight of a poll by 1/673 = 0.0015 every day since then.
To test the validity of this weighting system, I re-estimated every WAPA and probability using the following time-weighting system, based on the key dates of February 29 and June 1 described above:
- Only use polls whose field date midpoint is January 1, 2020 or later (that is, date weight for 2019 polls = 0)
- Weight polls released in January and February 2020 as before
- Weight polls released in March, April and May 2020 twice as much as before
- Weight polls released in June, July and August 2020 three times as much as before
- Weight polls in September and October 2020 four times as much as before
This system gives vastly more weight to the most recent polls and correspondingly much lower weight to earlier polls.
As one would expect from Figure 1, Biden’s national lead jumps to 8.0 points using this time-weighting method, though the projected EV total barely increases to 351.4, with only minor changes in the probability Biden wins any given state: Nevada (92.3% and Florida (90.7%) rise slightly, while Ohio (52.2%) and Georgia (40.1%) decline slightly.
However, state-level changes in WAPA are very telling, as Table 5 reveals:
Table 5: 2020 Polling Margins, Biden vs Trump, Using Two Time-Weighting Methods
| State | WAPA Original Time-Weight | WAPA Recent Time-Weight | Delta |
| Hawaii | 29.10 | 29.10 | 0.00 |
| California | 28.37 | 29.91 | 1.55 |
| Maryland | 24.60 | 24.49 | -0.11 |
| Massachusetts | 34.30 | 34.30 | 0.00 |
| New York | 25.89 | 27.03 | 1.15 |
| Connecticut | 17.91 | 18.62 | 0.71 |
| Delaware | 19.17 | 20.04 | 0.87 |
| Washington | 24.65 | 26.13 | 1.49 |
| New Jersey | 18.20 | 18.22 | 0.02 |
| New Mexico | 11.30 | 11.77 | 0.47 |
| Maine | 10.40 | 10.71 | 0.31 |
| Michigan | 7.02 | 7.57 | 0.55 |
| Colorado | 12.15 | 13.17 | 1.02 |
| Nevada | 3.76 | 4.34 | 0.58 |
| Minnesota | 7.73 | 8.34 | 0.60 |
| Virginia | 9.56 | 10.92 | 1.36 |
| Wisconsin | 5.00 | 5.93 | 0.94 |
| New Hampshire | 5.24 | 6.10 | 0.86 |
| Pennsylvania | 5.07 | 5.20 | 0.13 |
| Florida | 3.93 | 4.53 | 0.60 |
| Iowa | -1.61 | -1.08 | 0.53 |
| Ohio | 0.43 | 0.11 | -0.32 |
| North Carolina | 1.89 | 2.15 | 0.26 |
| Georgia | -0.70 | -0.87 | -0.17 |
| Arizona | 2.93 | 3.01 | 0.08 |
| Texas | -2.03 | -1.92 | 0.10 |
| South Carolina | -7.25 | -6.62 | 0.63 |
| Missouri | -6.28 | -5.71 | 0.57 |
| Indiana | -13.92 | -14.48 | -0.56 |
| Mississippi | -11.92 | -11.50 | 0.41 |
| Montana | -8.86 | -8.36 | 0.51 |
| Alaska | -4.33 | -4.01 | 0.32 |
| Louisiana | -11.19 | -11.19 | 0.00 |
| Kansas | -9.27 | -9.03 | 0.24 |
| Tennessee | -14.47 | -14.28 | 0.19 |
| Arkansas | -3.50 | -3.50 | 0.00 |
| Alabama | -18.19 | -17.95 | 0.24 |
| Kentucky | -17.05 | -17.82 | -0.77 |
| North Dakota | -20.42 | -19.13 | 1.28 |
| Utah | -13.11 | -13.88 | -0.77 |
| West Virginia | -34.30 | -34.30 | 0.00 |
| Oklahoma | -22.96 | -22.03 | 0.93 |
| Average | Biden+2.08 | Biden+2.48 | 0.40 |
Extending WAPA to two decimal places, Biden’s national lead increases by 0.46 points, from 7.50 to 7.97. However, rather than Biden increasing his lead by four or five points in some states, say, while decreasing his lead by three or four points in other states, only five states saw a decline in Biden’s average polling margin—Maryland, Georgia, Ohio, Kentucky and Utah; no decline was less than -0.77. And in only six states—Colorado, New York, North Dakota, Virginia, Washington and California—did Biden’s average polling margin increase by more than 1.00 points, with a maximum of 1.55. The standard deviation of the average change in Biden’s margin is only 0.55, showing how tightly bunched around the mean of 0.40 points these shifts are.
In other words, when switching to a time-weighting method which gives vastly more weight to polls released over the preceding three months while eliminating 2019 polls entirely, Biden saw his lead either not change or increase by up to 0.94 in 31 of 42 states. This remarkably consistent change should alleviate fears that Biden will win the popular vote by four or five points, yet still lose the Electoral College because he won even more votes than Clinton in safe states like California and New York while narrowing the 2016 margins in states like Georgia, Ohio and Texas without actually winning any of their EV. Instead, as Biden’s national margin increases, his lead in nearly every state—including nearly every swing state—increases correspondingly. Put differently, the same groups of voters fueling increases in Biden’s vote total in one set of states are also fuel increases in states like Michigan, Wisconsin, Pennsylvania and Florida—and perhaps Arizona and North Carolina as well.
Figure 2 makes this same point in a different way. It compares current Biden WAPA to simply increasing every 2016 Democratic margin increased by 5.4 points, the difference between Biden’s current national polling lead and the 2.1 points by which Clinton won in 2016.
Figure 2
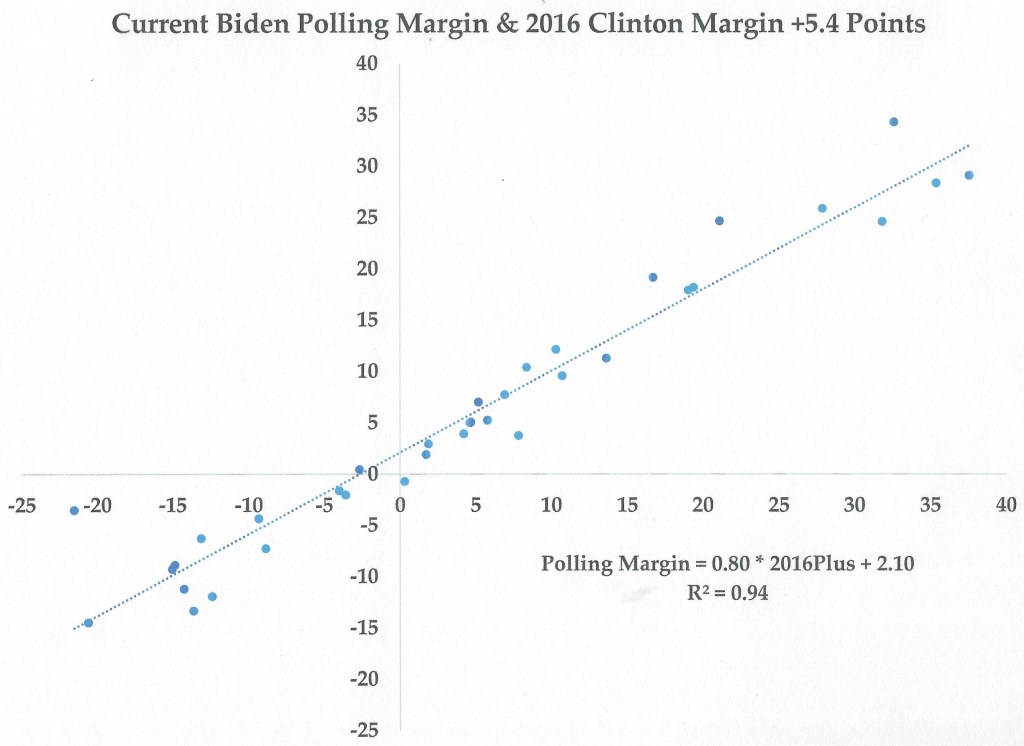
Figure 2 perfectly illustrates the adage “A rising tide lifts all boats,” or nearly all, anyway. Biden’s current state-level polling averages—as I calculate them—are astonishingly close to how you would expect him to fare in each state given a 5.4-point increase in the national Democratic margin.
**********
None of this is to say Biden is guaranteed to be elected president of the United States on in two months. There are worrisome signs this year’s elections will not be conducted as efficiently and transparently as they could be. Delays in mail delivery—allegedly orchestrated by a newly-confirmed Postmaster General—could leave millions of votes uncounted because they did not arrive by November 3. Moreover, while Biden’s national polling lead has consistently ranged between four and 10 points over the last 20 months, a late-recovering economy or last-minute “October surprise” could erase this lead.
All that being said, however, unlike Clinton in 2016, Biden has a sufficiently-wide range of paths to 270 EV that I estimate he is at least an 80% favorite to be elected president of the United States on November 3, 2020—or whenever ballots are ultimately counted.
Until next time…please stay safe and healthy…
[1] Includes one Redfield & Wilton Strategies poll conducted August 31 to September 1
[2] DC, Vermont, Rhode Island, Illinois, Oregon, Nebraska, South Dakota, Idaho, Wyoming
[3] That said, this does not account for mid-to-large states like Oregon and Illinois where Biden is expected to win by double-digit margins.
[4] The former value is the mean arithmetic difference between “expected” and actual D-R margins across 153 state-level contests in 2008, 2012 and 2016, while the latter value is the standard deviation of these values. I recognize this is not a standard error. However, using the value 13.6—the range of values covering 95% of all values divided by 1.96, the final EV projection changes by only 1.0.


😃
LikeLiked by 1 person
Well said,..
LikeLiked by 1 person