In a previous post, I implied that Hillary Clinton’s 2016 losses in five states won by Barack Obama in 2012–Pennsylvania, Ohio, Michigan, Wisconsin and Iowa—resulted from white voters without a college degree (14 percentage points less Democratic in 2016 than in 2012) averaging 44.4% of these states’ electorates, while white voters with a college degree (10 percentage points more Democratic than in 2012) averaged 38.0%.[1]
This steep decline for Democrats in 2016 among midwestern/Rust Belt white voters without a college degree is the bad news.
Today, I will present some good news.
Four states totaling 80 electoral votes (EV)—North Carolina, Georgia, Texas and Arizona—may be trending slowly toward the Democrats. Clinton lost all four of these states, as did Democratic nominees in 2004, 2008 (excepting a squeaker win in North Carolina) and 2012. However, the average margin by which she lost to Republican Donald Trump in these four states was 5.3 percentage points, about half the average 2004-12 margin (-10.2).[2]
This slow pro-Democratic trend is even clearer when you adjust for the national Democratic margins over the last four presidential elections, as shown in Table 1.
Table 1: National and State-Level Margins (Democratic % – Republican %), 2004-16
| Election | National Margin | Average Margin in NC, GA, TX, AZ | State Margin-National Margin |
| 2004 | -2.5 % points | -15.6 % points | -13.1 % points |
| 2008 | 7.3 % points | -6.3 % points | -13.5 % points |
| 2012 | 3.9 % points | -8.7 % points | -12.5 % points |
| 2016 | 2.1 % points | -5.3 % points | -7.4 % points |
Yes, on average, these four states were 7.4 percentage points less Democratic than the nation in 2016. But that is still a shift toward the Democrats of 5.6 percentage points compared to the 2004-12 average of -13.0 percentage points.
Put simply, as the country as a whole voted slightly more Republican in 2016, these states voted relatively more Democratic.
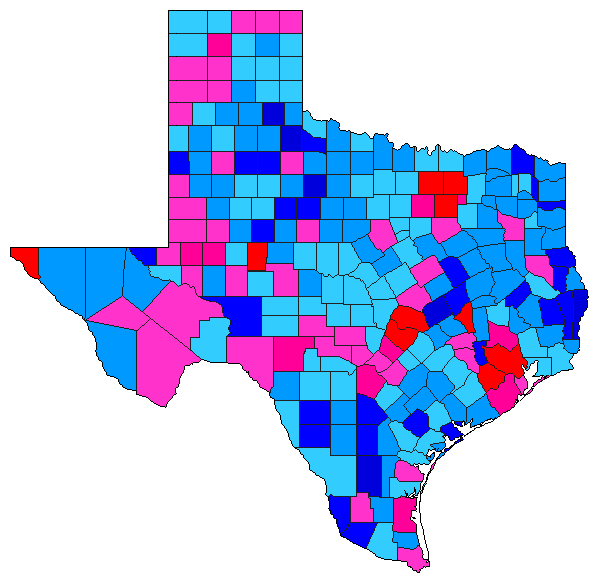
The maps in Figure 1, taken from Dave Leip’s indispensable Atlas of U.S. Presidential Elections, show the counties where Democrats performed better in 2016 than in 2012 (shades of pink and red[3]), and where they performed worse (shades of blue).
Figure 1. County-level change in voting margin (Democratic % – Republican %) from 2012 to 2016
Georgia

Texas
Arizona

North Carolina

In the five key states Clinton lost, she essentially matched Obama’s 2012 performance in the core urban Democratic areas of the state, while doing far worse than Obama elsewhere. In these four southeastern/southwestern states, however, Clinton actually improved on Obama’s 2012 performance in the urban (and surrounding suburbs) areas of the state. Specifically, Clinton improved on Obama’s 2012 performance in and around Atlanta and Savannah, Georgia; Austin, Dallas and Houston, Texas; Flagstaff, Phoenix and Tucson, Arizona (as well the border counties with Mexico); and Charlotte and Raleigh/Durham/Greensboro/Winston-Salem, North Carolina.
These four states also have populations that are far less white (average 55.0%, 65.5% of the 2016 presidential electorate) than the five key states Clinton lost (81.0%, 82.4% of the electorate). Their residents are also slightly more likely to have a college degree (27.9% to 26.2% of the population, 50.8% to 44.4% of the electorate).
And as Table 2 shows (data from here), while these electorates were less white overall[4], they averaged more white voters with a college degree (34.5%) than white voters without a college degree (31.0%). That said, while white voters with a college degree were far less Republican on average (R+24.2) than white voters without a college degree (R+46.8) in these states, they were still far more Republican than all such voters nationwide. In fact, the smaller the white proportion of these electorates, the more Republican white voters (with or without a college degree) were[5].
Table 2: Presidential Voting Margins Among White and Non-White Voters With and Without College Degrees, Nationally and in Four Democratic-Trending States
| State | White College | White Non-College | Non-White College | Non-White Non-College | ||||
| U.S. | +4 R | 37% | +39 R | 34% | +50 D | 13% | +56 D | 16% |
| NC | +19 R | 37% | +44 R | 33% | +63 D | 13% | +59 D | 17% |
| GA | +41 R | 30% | +66 R | 30% | +66 D | 20% | +72 D | 20% |
| TX | +31 R | 31% | +55 R | 26% | +28 D | 21% | +47 D | 22% |
| AZ | +6 R | 40% | +22 R | 35% | +22 D | 11% | +31 D | 14% |
Now, just bear with me while I briefly describe multiple linear regression.
Multiple linear regression is a statistical method that reveals how much a given (dependent) variable (say, state 2016 Democratic presidential margin) would change, on average, if other (independent) variables (say, state % white and % adults over 25 with a college degree[6]), changed by a specified amount. It also tells you how much of the variance in the dependent variable is “accounted for” (phrasing I prefer to “explained by”) the group of independent variables. Finally, it gives you an equation that can be used to calculate the “expected” value of the dependent variable given specified values of the independent variables.
Thus, using 2016 presidential election data from the 50 states and the District of Columbia, I estimated the following equation:
2016 Dem Margin = -0.53 – 0.51*% White + 2.94 *% College Degree
On average, then, a one percentage point increase in the white population of a state (all else being equal) lowered the 2016 Democratic margin in that state by an average 0.51 percentage points, while a corresponding increase in the percentage of adults over 25 with a college degree increased the Democratic margin by 2.94 percentage points. These two variables alone accounted for a whopping 75.4% of the variation in the 2016 state Democratic margins[7].
In 2013, the population of Massachusetts was 75.1% white and 28.0% of its residents over the age of 25 had a college degree. Plugging those values into the equation yields a “predicted” 2016 Democratic margin of 25.2, barely below the 27.2 percentage points by which Clinton actually won Massachusetts.
Table 3: Predicted and Actual 2016 Democratic Presidential Margins, Based Upon % White and % Adults with a College Degree, in Four States
| State | % White | % College Degree (Age >25) | Predicted 2016 Democratic Margin | Actual 2016 Democratic Margin |
| GA | 54.8% | 28.0% | D+2.0 | R+5.1 |
| TX | 44.0% | 26.7% | D+3.6 | R+9.0 |
| AZ | 56.7% | 29.6% | D+5.7 | R+3.5 |
| NC | 64.4% | 27.3% | R+5.0 | R+3.7 |
As Table 3 shows, this simple model “predicted” Clinton would win three states she lost: Georgia, Texas and Arizona. The average 9.6 percentage point gap between predicted and actual margins likely resulted from white voters with a college degree in these states voting more Republican than their counterparts elsewhere. Had this group voted as their national counterparts did in 2016 (R+4), all else being equal, Clinton would have won North Carolina’s 15 EV by 2.2 percentage points, Georgia’s 16 EV by 6.6 percentage points and Texas’ 38 EV by 0.7 percentage points, though she would still have lost Arizona’s 11 EV by 2.5 percentage points. Those extra 69 EV would have raised her total to 296, 26 more than necessary[8].
It is quite possible that the future of the Democratic Party lies with a three-part coalition of non-white voters, white voters with a college degree and younger voters (voters aged 18-39—37% of the electorate—voted for Clinton by 16 percentage points).
If this is indeed the case, then newly-elected Democratic National Committee chairman Tom Perez may want to think about putting less emphasis on midwestern and Rust Belt states with a large proportion of whites without a college degree[9] to focus instead on south Atlantic states like Georgia and North Carolina, and southwestern states like Texas and Arizona, whose electorates will become even more dominated by this three-part coalition in the future.
Until next time…
[1] At a practical level, this means that she lost the vast majority of white, low-population, rural counties in these states by an average 363,000 votes—and 14.0 percentage points—than Obama had four years earlier, while holding her own in the Democratic core counties.
[2] For comparison, Clinton lost the five key Midwestern/Rust Belt states by an average of 3.8 percentage points.
[3] Unlike every other news outlet or data analyst, Dave Leip colors Democratic areas red and Republican areas blue.
[4] The mix of non-white voters varies across by state, with Arizona and Texas having a higher Latino population (30.3 and 38.4%, respectively) and Georgia and North Carolina having a higher Black population (31.4 and 22.0%). Black voters supported Clinton by a margin of 81% percentage points, while Latinos did so by a margin of 38 percentage points.
[5] A thoroughly irrelevant sidebar: this effect (white voters becoming more Republican as the non-white population increases) inspired the “demographic trait activation” hypothesis I was going to test in my political science doctoral program. The one I never finished (though I did get a Master’s Degree out of it).
[6] 2013 data
[7] The “predictive value” of a state’s percentage white or college educated was also higher in 2016 than in 2012. In 2012, a one percentage point increase in state percentage white decreased that state’s Democratic margin 0.37 percentage points and a one percentage point increase in state percentage of adults with a college degree increased the margin 2.65 percentage points. These two variables accounted for just over half (56.5%) of the variation in the 2012 state Democratic margins.
[8] The total would be 301, but for five “faithless” electors.
[9]Acknowledging, of course, the very close margins in Michigan, Pennsylvania and Wisconsin (as well as in Minnesota: Clinton+1.5), suggesting that simply activating more voters belonging to this three-part coalition could easily flip these states Democratic again.


24 thoughts on “Should Democrats look to the southeast and southwest?”