In this May 2017 post, I took a “wicked early” look at the 2018 U.S. Senate (Senate) races. Depending on whether Democrat Doug Jones or Republican Roy Moore wins the December 12 special Senate election in Alabama, Republicans will control 51 or 52 Senate seats heading into the 2018 midterm elections. Democrats (46 or 47 plus two Independents who caucus with them, Bernie Sanders of Vermont and Angus King of Maine) would thus need to win a net gain of either two or three Senate seats to regain control of the Senate following the 2018 elections. At the same time, Republicans would need to net eight seats to have 60, a filibuster-proof majority.
Democrats (including Sanders and King) will defend 26 seats—10 in states won by 2016 Republican presidential nominee Donald Trump (five by double-digits)—while Republicans will only defend eight seats (only one won by 2016 Democratic presidential nominee Hillary Clinton). It had been 25 seats, but the impending resignation of Minnesota Democratic Senator Al Franken means that seat will also be up for election in 2018. I do not know whether whomever Minnesota’s Democratic governor, Mark Dayton, appoints to fill that seat (Lieutenant Governor Tina Smith is the frontrunner) will seek reelection.
Table 1: U.S. Senate Seats up for Election in 2018
| Current Senator | State | Run 2018? | 3W-RDM | 2012 Margin | Ave. Pre-2012 Margin (# Races) |
| DEMOCRATS/INDEPENDENTS | |||||
| Mazie Hirono | HI | Yes | 34.3 | 25.2% | N/A (0) |
| Bernie Sanders | VT | Yes | 27.7 | 46.2% | 33.1% (1) |
| Dianne Feinstein | CA | Yes | 23.2 | 25.0% | 15.5% (4) |
| Ben Cardin | MD | Yes | 22.6 | 29.7% | 10.0% (1) |
| Elizabeth Warren | MA | Yes | 22.1 | 7.6% | N/A (0) |
| Kirsten Gillibrand | NY | Yes | 21.6 | 45.9% | 27.8% (1) |
| Sheldon Whitehouse | RI | Yes | 18.0 | 29.8% | 7.0% (1) |
| Chris Murphy | CT | Yes | 12.8 | 11.8% | N/A (0) |
| Tom Carper | DE | Yes | 12.5 | 37.5% | 25.7% (2) |
| Maria Cantwell | WA | Yes | 12.1 | 20.9% | 8.5% (2) |
| Bob Menendez | NJ | Yes | 12.0 | 19.5% | 9.0% (1) |
| Martin Heinrich | NM | Yes | 6.5 | 5.7% | N/A (0) |
| Angus King | ME | Yes | 5.9 | 22.2% | N/A (0) |
| Debbie Stabenow | MI | Yes | 2.2 | 20.8% | 8.6% (2) |
| Amy Klobuchar | MN | Yes | 1.5 | 34.7% | 20.1% (1) |
| TBD | MN | ??? | 1.5 | N/A | N/A |
| Tim Kaine | VA | Yes | 1.5 | 5.9% | N/A (0) |
| Tammy Baldwin | WI | Yes | 0.7 | 5.6% | N/A (0) |
| Bob Casey | PA | Yes | -0.4 | 9.1% | 17.4% (1) |
| Bill Nelson | FL | Yes | -3.4 | 13.0% | 13.5% (2) |
| Sherrod Brown | OH | Yes | -5.8 | 6.0% | 13.3% (1) |
| Claire McCaskill | MO | Yes | -15.9 | 15.7% | 2.3% (1) |
| Joe Donnelly | IN | Yes | -16.3 | 5.7% | N/A (0) |
| Jon Tester | MT | Yes | -18.6 | 3.7% | 0.9% (1) |
| Heidi Heitkamp | ND | Yes | -29.4 | 0.9% | N/A (0) |
| Joe Manchin | WV | Yes | -35.5 | 24.1% | 10.1% (1) |
|
REPUBLICANS |
|||||
| Dean Heller | NV | Yes | 2.0 | 1.2% | Appointed 2011 |
| Jeff Flake | AZ | No | -9.7 | 3.0% | N/A (0) |
| Ted Cruz | TX | Yes | -15.3 | 15.8% | N/A (0) |
| Roger Wicker | MS | Yes | -18.5 | 16.6% | 9.9% (1*) |
| Deb Fischer | NE | Yes | -25.8 | 15.5% | N/A (0) |
| Bob Corker | TN | No | -25.8 | 34.5% | 2.7% (1) |
| Orrin Hatch | UT | ??? | -33.1 | 35.3% | 27.8% (6) |
| John Barrasso | WY | Yes | -45.7 | 54.0% | 46.8% (1†) |
* Wicker won a special election in 2010 to fill Republican Trent Lott’s seat after he
was forced to resign.
† Barrasso won a special election in 2008 after the death of Republican Craig Thomas
As you can see from the italicized-boldfaced elements of Table 1, there have been significant changes other than the Franken resignation.
- Delaware Democratic Senator Tom Carper announced his reelection bid (and Wisconsin Democratic Senator Tammy Baldwin was already seeking reelection—my mistake), meaning every Democratic incumbent elected in 2012 will be on the ballot in 2018. This should help the Democrats significantly, as I explain below.
- Two Republican Senators, Jeff Flake of Arizona and Bob Corker of Tennessee, announced they would not seek reelection. This could also help Democrats, as Republicans will no longer have the incumbency advantage in these races.
- Republican Utah Senator Orrin Hatch may run for reelection in 2018 after all. This will not materially impact Democrats’ chances next year, as any Republican would be heavily favored to win this seat.
**********
In my most recent post, I assessed the validity of 3W-RDM[1], my measure of how much more or less Democratic a state is than the nation, by comparing it to two publicly-available measures, the Cook Partisan Voting Index (Cook PVI) and the fivethirtyeight.com “partisan lean” (538 PL).
Compared to Cook PVI (5.0) and 538 PL (4.8), 3W-RDM (5.4) had a slightly higher average absolute difference between projected and actual vote margins. In other words, if the Democratic presidential candidate in 2020 were to win nationally by 1 percentage point, I would expect Pennsylvania (3W-RDM=-0.4) to vote for that candidate by 1.0 – 0.4 = 0.6 percentage points. On average, however 3W-RDM misses by 5.4 percentage points in either direction, meaning the Democrat could win by 6.0 percentage points or lose by 4.8 percentage points.
In the rest of this post, I will use a combination of 3W-RDM, proposed 2018 partisan environments, and an estimated incumbency effect to examine the 2018 Senate elections more closely.
*********
Just bear with me while I briefly explain how I estimated the electoral advantage of incumbency using data from the 2012, 2014 and 2016 Senate races (n=101; every state has ≥two Senate elections in the analysis)
Unless otherwise noted, electoral data are from Dave Leip’s indispensable Atlas of U.S. Presidential Elections.
I first calculated the difference between total Democratic and total Republican votes cast nationwide for Senate in each year, requiring some vote allocation decisions.
- In 2012, there were 33 Senate races, including victories by Sanders and King. Because they caucus with Senate Democrats, I included their votes in the Democratic total, bumping up the Democratic margin in the total national Senate vote from 11.6 to 12.1 percentage points.
- In 2014, there were 35 Senate races; both Oklahoma and South Carolina had an extra Senate election due to retirements (Republicans Tom Coburn and Jim DeMint, respectively). In the Alabama Senate race, Republican Jeff Sessions ran unopposed, receiving 795,506 votes; I excluded this election from the analysis. Minus those votes, Republicans won the total national Senate vote by 5.8 percentage points (down from 7.5 with Sessions’ votes).
- In 2016, there were 34 Senate races. In California, every candidate to succeed retiring Democratic Senator Barbara Boxer ran in a “jungle” primary held on June 7, 2016; the top two vote getters, Democrats Kamala Harris and Loretta Sanchez, faced off in the general election (combining for nearly 12 million votes; Harris won with 61.6%). Rather than inflate the national Democratic margin by including superfluous Democratic votes, I used the sum of the primary votes cast for each party’s candidates (7 Democrats, 12 Republicans, 15 “other”) as the “Democratic,” “Republican” and “other” Senate votes from California. Louisiana also uses a “jungle” primary system, with every candidate running in the general election; if no candidate wins more than 50% of the total vote cast, the top two vote-getters compete in a runoff election. On November 8, 2016, Republican John Kennedy led the field with 25.0% of the vote, followed by Democrat Foster Campbell at 17.5%. In the December 10 runoff election, Kennedy won 60.7% of the vote, just shy of the 61.3% won by all eight Republicans on November 8. For simplicity, I used the runoff votes in my national Senate vote totals. These adjustments dropped the Democratic margin from 10.8 to 0.9 percentage points in 2016.
Next, I calculated a “projected” Democratic margin for all 101 Senate races by adding each state’s 3W-RDM[2] to either 12.1 (2012), -5.8 (2014) or 0.9 (2016), yielding an estimate of what the Democratic margin would be in a Senate matchup between a generic Democrat and a generic Republican.
Finally, I subtracted the actual margin from the projected margin. I would expect incumbents to fare better than projected, on average; of 76 incumbents seeking reelection (38 from each party), 56 (73.7%) beat their projected margins.
For example, in 2014, Virginia Democratic Senator Mark Warner ran for reelection. Virginia’s 3W-RDM was D-1.2, and the Democrats lost nationally by 5.8 percentage points. Adding -5.8 to -1.2 yields -7.0, meaning you would have expected a generic Democrat to lose by 7.0 percentage points (+/-5.4). Warner actually won by 0.8 percentage points, meaning he did 7.8 percentage points better than projected.
Table 2: Average Differences Between Actual and “Projected” Democratic Margins in Senate Races, 2012-2016, by Party and Incumbency[3]
| Year | DEM Incumbent | GOP Incumbent | No Incumbent |
| 2012 | D+5.1 (n=16) | D-19.9 (n=6) | D-3.4 (n=11) |
| 2014 | D+10.7 (n=15) | D-0.2 (n=10) | D+0.9 (n=9) |
| 2016 | D+10.4 (n=7) | D-7.5 (n=22) | D+3.9 (n=5) |
| Overall | D+8.3 (n=38) | D-7.5 (n=38) | D-0.4 (n=25) |
As Table 2 shows, while incumbency advantage varied by year (incumbent Republican Senators did an average of 19.9 percentage points better than expected in 2012, but only 0.2 percentage points better in 2014), incumbent Democratic and Republican Senators beat their projected margins by 8.3 and 7.5 percentage points, respectively, overall. By comparison, the actual and projected margins differed by an average of only 0.4 percentage points in the 25 Senate races with no incumbent (15 held by a Democrat, 10 by a Republican), an encouraging result given that these are the races that come closest to featuring a generic Democrat and a generic Republican[4].
**********
Table 3 below displays estimated Democratic margins (+/-5.4; these are NOT formal confidence intervals) for all 34 2018 Senate elections under three conditions:
- Democrats win the total national Senate vote by 8.1 percentage points, the current “generic ballot” polling average calculated by fivethirtyeight.com.
- Democrats and Republicans split the national vote evenly.
- Democrats win the total national Senate vote by 11.6 percentage points, the median margin by which Democrats have won the total national Senate vote in the last seven elections in which they had a “wave” (which I arbitrarily define as ≥7.0 percentage points): 2008 (7.4), 1982, 2006, 2012, 1976, 1970, 1974 (15.7).
Table 3: Projected Democratic Margins in 2018 U.S. Senate Elections Under 3 Scenarios (+/- average 5.4 percentage point absolute value prediction error)
| Current Senator | State | 3W-RDM | Dems +8.1 | Dems even | Dems +11.6 |
| DEMOCRATS/INDEPENDENTS | |||||
| Mazie Hirono | HI | 34.3 | D+50.7
(+45.3, +56.1) |
D+42.1
(+36.7, +47.5) |
D+54.2
(+48.8, +59.6) |
| Bernie Sanders | VT | 27.7 | D+44.1
(+38.7, +49.5) |
D+35.5
(+30.1, +40.9) |
D+47.6
(+42.2, +53.0) |
| Dianne Feinstein | CA | 23.2 | D+39.6
(+34.2, +45.0) |
D+31.0
(+25.6, +36.4) |
D+43.1
(+37.7, +48.5) |
| Ben Cardin | MD | 22.6 | D+39.0
(+33.6, +44.4) |
D+30.4
(+25.0, +35.8) |
D+42.5
(+37.1, +47.9) |
| Elizabeth Warren | MA | 22.1 | D+38.5
(+33.1, +43.9) |
D+29.9
(+24.5, +35.3) |
D+42.0
(+36.6, +47.4) |
| Kirsten Gillibrand | NY | 21.6 | D+38.0
(+32.6, +43.4) |
D+29.4
(+24.0, +34.8) |
D+41.5
(+36.1, +46.9) |
| Sheldon Whitehouse | RI | 18.0 | D+34.4
(+29.0, +39.8) |
D+25.8
(+20.4, +31.2) |
D+37.9
(+32.5, +43.3) |
| Chris Murphy | CT | 12.8 | D+29.2
(+23.8, +34.6) |
D+20.6
(+15.2, +26.0) |
D+32.7
(+27.3, +38.1) |
| Tom Carper | DE | 12.5 | D+28.9
(+23.5, +34.3) |
D+20.3
(+14.9, +25.7) |
D+32.4
(+27.0, +37.8) |
| Maria Cantwell | WA | 12.1 | D+28.5
(+23.1, +33.9) |
D+19.9
(+14.5, +25.3) |
D+32.0
(+26.6, +37.4) |
| Bob Menendez | NJ | 12.0 | D+28.4
(+23.0, +33.8) |
D+19.8
(+14.4, +25.2) |
D+31.9
(+26.5, +37.3) |
| Martin Heinrich | NM | 6.5 | D+22.9
(+17.5, +28.3) |
D+14.3
(+8.9, +19.7) |
D+26.4
(+21.0, +31.8) |
| Angus King | ME | 5.9 | D+22.3
(+16.9, +27.7) |
D+13.7
(+8.3, +19.1) |
D+25.8
(+20.4, +31.2) |
| Debbie Stabenow | MI | 2.2 | D+18.6
(+13.2, +24.0) |
D+10.0
(+4.6, +15.4) |
D+22.1
(+16.7, +27.5) |
| Amy Klobuchar | MN | 1.5 | D+17.9
(+12.5, +23.3) |
D+9.3
(+3.9, +14.7) |
D+21.4
(+16.0, +26.8) |
| TBD | MN | 1.5 | D+9.7
(+4.3, +15.1) |
D+1.1
(-4.3, +6.5) |
D+13.2
(+7.8, +18.6) |
| Tim Kaine | VA | 1.5 | D+17.9
(+12.5, +23.3) |
D+9.3
(+3.9, +14.7) |
D+21.4
(+16.0, +26.8) |
| Tammy Baldwin | WI | 0.7 | D+17.1
(+11.7, +22.5) |
D+8.5
(+3.1, +13.9) |
D+20.6
(+15.2, +26.0) |
| Bob Casey | PA | -0.4 | D+16.0
(+10.6, +21.4) |
D+7.4
(+2.0, +12.8) |
D+19.5
(+14.1, +24.9) |
| Bill Nelson | FL | -3.4 | D+13.0
(+7.6, +18.4) |
D+4.4
(-1.0, +9.8) |
D+16.5
(+11.1, +21,9) |
| Sherrod Brown | OH | -5.8 | D+10.6
(+5.2, +16.0) |
D+2.0
(-3.4, +7.4) |
D+14.1
(+8.5, +19.5) |
| Claire McCaskill | MO | -15.9 | D+0.5
(-4.9, +5.9) |
D-8.1
(-13.5, -2.7) |
D+4.0
(-1.4, +9.4) |
| Joe Donnelly | IN | -16.3 | D+0.1
(-5.3, +5.5) |
D-8.5
(-13.9, -3.1) |
D+3.6
(-1.8, +9.0) |
| Jon Tester | MT | -18.6 | D-2.2
(-7.6, +3.2) |
D-10.8
(-16.2, -5.4) |
D+1.3
(-4.1, +6.7) |
| Heidi Heitkamp | ND | -29.4 | D-13.0
(-18.4, -7.6) |
D-21.6
(-27.0, -16.2) |
D-9.5
(-14.9, -4.1) |
| Joe Manchin | WV | -35.5 | D-19.1
(-24.5, -13.7) |
D-27.7
(-33.1, -22.3) |
D-15.6
(-21.0, -10.2) |
|
REPUBLICANS |
|||||
| Dean Heller | NV | 2.0 | D+2.6
(-2.8, +8.0) |
D-5.5
(-10.9, -0.1) |
D+6.1
(+0.7, +11.5) |
| Jeff Flake | AZ | -9.7 | D-1.5
(-6.9, +3.9) |
D-9.6
(-15.0, -4.2) |
D+2.0
(-3.4, +7.4) |
| Ted Cruz | TX | -15.3 | D-14.7
(-20.1, -9.3) |
D-22.8
(-28.2, -17.4) |
D-11.2
(-16.6, -5.8) |
| Roger Wicker | MS | -18.5 | D-17.9
(-23.3, -12.5) |
D-26.0
(-31.4, -21.6) |
D-14.4
(-19.8, -9.0) |
| Deb Fischer | NE | -25.8 | D-25.2
(-30.6, -19.8) |
D-33.3
(-38.7, -27.9) |
D-21.7
(-27.1, -16.3) |
| Bob Corker | TN | -25.8 | D-17.6
(-23.0, -12.2) |
D-25.7
(-31.1, -20.3) |
D-14.1
(-19.5, -8.7) |
| Orrin Hatch | UT | -33.1 | D-32.5
(-37.9, -27.1) |
D-40.6
(-45.8, -35.2) |
D-29.0
(-34.4, -23.6) |
| John Barrasso | WY | -45.7 | D-45.1
(-50.5, -39.7) |
D-53.2
(-58.6, -47.8) |
D-41.6
(-47.0, -36.2) |
Let me be very clear: the margins presented in Table 3 are NOT predictions[5], they are estimates of what the Democratic margin would be in a Senate race given the state’s partisan lean, the national political environment and whether an incumbent is running; candidate quality and campaigns can (and will) result in different margins on Election Day 2018. These estimates serve as helpful context for anticipating what may happen in these elections in 2018, which I address next.
Safe incumbents. In the worst-case scenario for Democrats (even with Republicans nationally; every Democrat loses 5.4 percentage points), nine Democrats (plus Sanders) would still be projected to win by at least 10.0 percentage points: Mazie Hirono, Dianne Feinstein, Ben Cardin, Elizabeth Warren, Kirsten Gillibrand, Sheldon Whitehouse, Chris Murphy, Tom Carper and Maria Cantwell. New Mexico’s Martin Heinrich and King should also be considered safe, projected to win by 8.9 and 8.3 percentage points, respectively, in this scenario[6].
New Jersey Democratic Senator Bob Menendez would be in this safe category but for the fact that he has been indicted for bribery, although his trial ended in a hung jury. One estimate of the impact of scandal is that it shaves 12.6 percentage points off an incumbent’s reelection margin. In the worst-case scenario, though, Menendez would still be projected to eke out a 1.8 percentage point victory. Absent a top-notch Republican challenger, I would consider Menendez safe…for now[7].
In the worst-case scenario for Republicans (lose by 11.6 percentage points nationally; every Democrat gains 5.4 percentage points), three Republicans (plus whoever the Republicans nominate in Utah) would still be projected to win by at least 9.0 percentage points: Roger Wicker, Deb Fischer and John Barrasso.
Let’s consider these 16 races Safe.
Less-safe, though still-favored incumbents. Five Democrats would still be projected to win by at least 2.0 percentage points in their worst-case scenario: Debbie Stabenow, Amy Klobuchar, Tim Kaine, Tammy Baldwin and Bob Casey. Stabenow, Baldwin and Casey represent the three states (Michigan, Wisconsin, Pennsylvania) Trump won by a combined 77,744 votes, allowing him to win the Electoral College. Klobuchar and Kaine, the 2016 Democratic vice-presidential nominee, represent states (Minnesota, Virginia) that are only slightly more Democratic (D+1.5) than the nation as a whole. Still, even with only a modest Democratic performance in 2018, these five Democrats should win reelection fairly easily.
Texas Republican Senator Ted Cruz would still be projected to win by 5.8 percentage points in his party’s worst-case scenario, making him likely safe. It is worth pointing out, however, that the only public poll of a match-up between Cruz and his likely Democratic opponent, U.S. Representative Beto O’Rourke, showed each receiving only 30%, with an astonishing 37% undecided. I have argued elsewhere that Democrats would be wise to look to southwestern states like Texas and Arizona for future electoral success. If Democrats are having a historically good night next November, Cruz could be in trouble.
Overall, that is an additional six seats that are Likely.
Bill Nelson and Sherrod Brown (plus Al Franken’s seat). As incumbent Democratic Senators representing Republican-leaning states (Florida, Ohio) in a strong Democratic year, my best estimate (Democrats win by 8.1 percentage points nationally, no error in 3W-RDM estimates, Democratic incumbency advantage of 8.3 percentage points) is that each would beat a generic Republican opponent by 10-13 percentage points (+/-5.4). Any Democrat Senate nominee in Minnesota would be expected to do similarly well.
However, should Republicans do far better than expected in 2018, Ohio continues to trend sharply Republican and/or strong potential challengers like Florida governor Rick Scott or former Minnesota governor Tim Pawlenty run, these three Democratic seats could be vulnerable. I would also note Nelson and Brown appeared to have no incumbency advantage in 2012, when their actual margins differed from projected margins by an average of only -0.1%. And in the worst-case Democratic scenario, a generic Republican would win these races by low-single-digit margins.
At the same time, Hurricanes Irma and Maria have displaced thousands of Puerto Ricans—who tend to vote Democratic—to Florida, which could boost Nelson in 2018.
These races, then, are “canaries in the coal mine” for 2018. If polls in the spring and summer of 2018 show these three races tied, or Republicans ahead, that would be a bad sign for Democrats. But if Democrats open up substantial leads in these three races, Democrats could be on the verge of an historic wave.
For now, let’s call them Lean Democratic.
Five Trump-state Democrats. Claire McCaskill, Joe Donnelly, Jon Tester, Heidi Heitkamp and Joe Manchin—representing five states averaging 23.1 points more Republican than the nation—should be in deep trouble. Even in the best-case scenario for Democrats, the latter two would be projected to lose by an average of 7.2 percentage points.
My best estimate is that McCaskill, Donnelly and Tester would be in toss-up races against a generic Republican, while Heitkamp and Manchin would lose by an average of 16.0 percentage points.
And this may well be how Election Day 2018 plays out for Democrats—a loss of two seats from these five.
It is noteworthy, however, that in 2012 (an excellent year for Democrats), these five Democrats beat their projected margins by an average of 11.6 percentage points. These five Democratic Senators clearly understand how to win in very Republican states.
Manchin did especially well, beating his expected margin by 26.8 percentage points! Indeed, as West Virginia was trending sharply Republican (D+9.2 to D-35.5 in just six elections), Manchin won four statewide elections for governor (2004, 2008) and Senator (2010, 2012) by an average of 27.0 percentage points. It is telling that Jim Justice, elected governor of West Virginia as a Democrat in 2016 only to become a Republican in 2017, endorsed Manchin’s reelection.
Based solely on the best estimate projections, though, I will call Indiana, Missouri and Montana toss-ups and North Dakota and West Virginia Lean Republican, though it is plausible that Democrats hold all of them.
Bob Corker’s seat. Tennessee’s strong Republican lean (D-25.8) means that under the best-case scenario for Democrats, a generic Democrat would lose to a generic Republican by 8.7 percentage points, with a “best guess” loss of 17.6 percentage points. This would seem to be a seat Republicans would keep fairly easily.
However, the announcement that former Democratic governor Phil Bredesen would run could alter that assessment. Bredesen won his first election in 2002 by only 3.1 percentage points before winning reelection in 2006 by an astonishing 38.9 percentage points.
Notes of caution, however, come from the experience of other Democrats—Bob Kerrey (Nebraska) in 2012; Russ Feingold (Wisconsin), Evan Bayh (Indiana) and Ted Strickland (Ohio) in 2016—who ran for the Senate at least four years after last holding statewide office. Each lost, and by an average of 12.4 percentage points.
For now, I would put Tennessee in the Lean Republican category.
Dean Heller and Jeff Flake’s seat. Excluding the special Senate election in Alabama, these are the two seats Democrats are most likely to flip.
Heller is the only Republican Senator seeking reelection in 2018 in a state Clinton won in 2016. That my best estimate has Heller losing by “only” 2.6 percentage points is due solely to his incumbency: a generic Republican (say, Danny Tarkanian, who is mounting a serious primary challenge to Heller). In the worst-case scenario for Democrats, Heller would be projected to win by 10.9 percentage points.
Democrats are also boosted by a strong likely nominee: first-term U.S. Representative Jacky Rosen. The Democratic lean of the state in a Democratic year, even with Heller’s incumbency advantage, suggests this race is more likely than not to flip to the Democrats.
I will call it Lean Democrat.
Flake, finally, was already facing a strong challenge from Democratic U.S. Representative Kyrsten Sinema (and a strong primary challenge from Kelli Ward) although as an incumbent, my best estimate would have projected a 9.0 percentage point win.
As an open seat, however, this looks like a close race (best estimate: Republican wins by 1.5 percentage points, +/-5.4), and I thus consider this race a Toss-up.
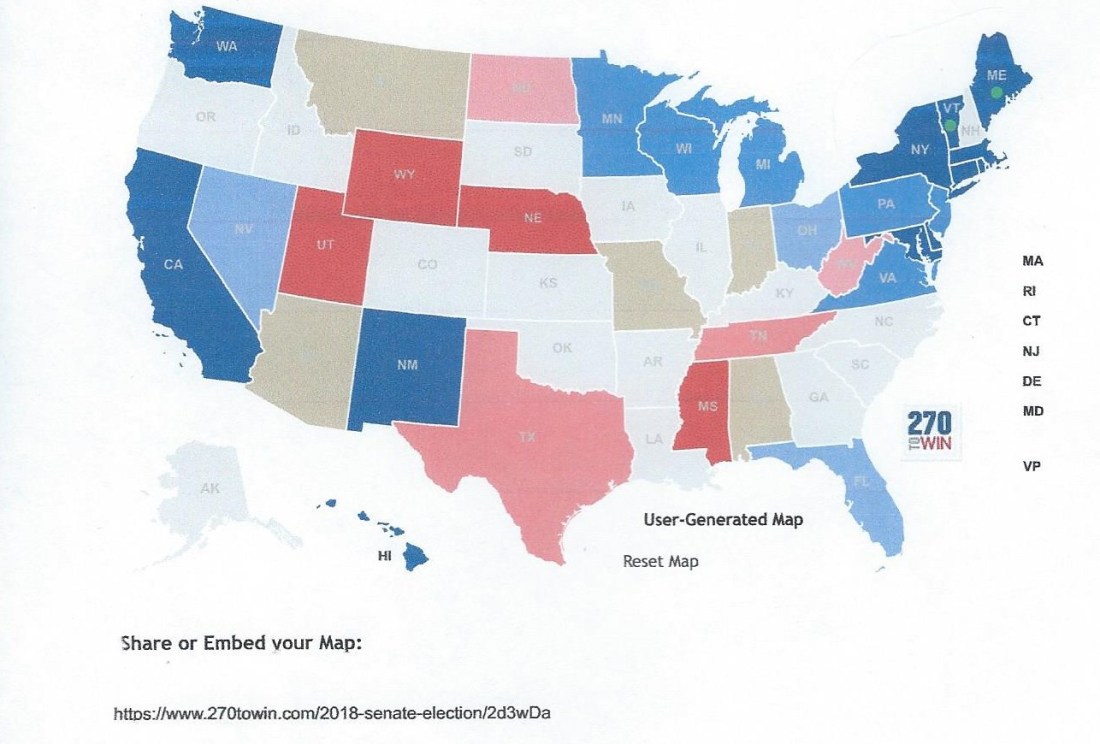
Conclusion? As this map (courtesy of 270towin.com) shows, the partisan landscape for 2018 shows Democrats favored in Nevada, Republicans perhaps favored in North Dakota and West Virginia, and the outcome uncertain in Alabama, Arizona, Indiana, Missouri and Montana.
There is a plausible path for Democrats to net three (or more) seats, and there is a (less) plausible path for Republicans to net eight seats.
The likeliest outcomes are between Democrats net losing five and gaining three, with a midpoint of Democrats net losing one (lose two of the five Trump-state Democratic seats plus Alabama and Arizona, win Nevada, hold Franken’s seat).
But 18 of the 34 races remain less than safe for either party…and that is exciting.
Until next time…
[1] It is the weighted average (1-2-3) of the difference between a state’s presidential margin (Democratic % of total vote minus Republican % of total vote) and the national presidential margin over the last three presidential elections.
[2] For the 2012 Senate elections, 3W-RDM was calculated using presidential election data from 2000, 2004 and 2008, and for the 2014 and 2016 elections, data from 2004, 2008 and 2012 were used.
[3] For Sanders and King in 2012, the margin is Independent% – GOP% (Sanders had no Democratic opponent; King beat Republican Charles Summers 52.9- 30.7%, with Democrat Cynthia Gill finishing 3rd with 13.3%). In the 2014 South Dakota Senate race, Independent Larry Pressler (a former Republican Senator) won 17.1% of the vote, possibly cutting into the margin (20.9 percentage points) by which Republican Mike Rounds beat Democrat Rick Weiland. In the 2016 Alaska Senate race, incumbent Republican Lisa Murkowski won with 44.4% of the vote, ahead of two Independents (Joe Miller [29.2%) and Margaret Stock [13.2%], with Democrat Ray Metcalfe finishing 4th with 11.6%. I used the margin between Murkowski and Metcalfe (-32.7 percentage points); using the margin over Miller (a Tea Party Republican) seemed inappropriate and would not have markedly changed the results.
[4] I considered using -0.4 as the baseline for my “incumbency advantage” average, rather than 0.0, but I decided it was close enough to 0.0 to be statistical noise.
[5] I don’t really expect Mazie Hirono to win by 51 percentage points, though she could. Ditto John Barrasso winning by 45 percentage points.
[6] Were Republican governor Paul LePage to run against King that could make this race closer, though that is likely if LePage’s current 42% approval rating (against 52% disapproval) holds.
[7] Of course, if Menendez’ polling numbers started tanking in 2018, he could well resign (or announce he was not seeking reelection). A Democratic replacement appointed by incoming Democratic governor Phil Murphy—or a Democratic nominee—would face a worst-case projected margin of D+6.1.


7 thoughts on “A less-wicked-early look at the 2018 U.S. Senate Elections”