On September 26, 2022, I published an updated set of projections for who will have the majority in the United States House of Representatives (“House”) following the 2022 elections, as well as who will win the 35 elections for the United States Senate (“Senate”) and 36 elections for governor. Since then, an additional 14 generic ballot polls – which I use to estimate the probability Democrats retain their House majority – have been released, along with 33 new Senate polls and 35 new governor’s race polls.
When I calculate a weighted-adjusted polling average, or WAPA, I adjust each poll’s Democratic and Republican percentages by the historic partisan bias calculated by FiveThirtyEight.com in their pollster ratings. This “bias” is simply how much, on average, a pollster missed the final margin of an election compared to other pollsters in that election during its final month. FiveThirtyEight.com also notes whether a poll was conducted for a partisan organization or candidate; if the organization is Democratic/progressive, I use the average of bias and -3.5, and if the organization is Republican/conservative, I used the average of bias and 3.5. For example, Rasmussen Reports has a historic bias of 1.5 points Republican, but they poll for very conservative outfits like Miranda Devine’s Laptop From Hell. Averaging 1.5 and 3.5 yields 2.5, meaning I add half of 2.5, or 1.25, to the Democratic percentage and subtract it from the Republican percentage. Thus, I treat a Rasmussen poll showing a Democrat with 44% and a Republican with 45% is treated like the Democrat had 45.25% and the Republican had 43.75%.
Consider the 498 generic ballot polls – how a respondent would choose between an unnamed Democrat and Republican if the election in their district were held today – conducted since January 2021. The average margin adjustment is 0.7 percentage points (“points”) towards the GOP, while the average adjustment across all pollsters is 0.2 points toward the GOP; recall that I average two WAPA for each election – one treating all polls as statistically independent, and one using a time-and-bias-adjusted average from each pollster as a single “poll.” The mean margin adjustment, unadjusted for time or pollster quality, is thus 0.5 points towards the Republican candidate; a majority of the 64 pollsters (57%) assessing the generic ballot at least once skew at least slightly Democratic, while 35% skew Republican (the remainder have too few polls for a valid bias calculation). This is very close to the average 1.1-point systematic Democratic bias in polling since 1998.
But, as Nate Silver points out in the same article in which he calculates prior polling biases, past is not necessarily prologue. While polls could once again be systematically biased, it is impossible to know whether that bias will be towards Democrats, Republicans or neither. By extension, then, just because Morning Consult – for example – has historically overestimated Democratic margins by 2.9 points does not mean they will do so again in 2022.
In fact, it is not clear how ANY pollster will perform in 2022, leading me to ask what WAPA would look like if I assumed every non-partisan pollster had zero bias, while adding -3.5 to every Democratic candidate/organization poll and 3.5 to every Republican candidate/organization poll.
Using this method, the Democratic lead on the generic ballot across all 498 polls increases 1.0 points to 1.3 points. Looking only at the 44 polls conducted entirely since Labor Day, meanwhile, shows a similar increase in Democratic lead of 0.9 points to 2.2 points. Both values are essentially the same as the post-1996 historic bias.
Table 1 compares WAPA and Democratic win probability for every election in which there are at least three polls and initial probability is between 15% and 85%, as well as my “sleeper” pick, the Senate election in Florida between Democratic House Member Val Demings and Republican incumbent Marco Rubio.
Table 1: WAPA and Democratic win probabilities for 10 closest 2022 Senate and gubernatorial elections
| Election | Initial Values | Readjusted Values | Difference |
| Senate | |||
| Florida | D-4.7% | D-4.0 | D+0.7 |
| 6.0% | 9.5% | +3.5 | |
| Georgia | D+1.8 | D+2.5 | D+0.7 |
| 70.4% | 80.0% | +9.6 | |
| Nevada | D-0.2 | D+0.8 | D+1.0 |
| 52.2% | 59.1% | +6.9 | |
| North Carolina | D-0.9 | D+0.3 | D+1.2 |
| 41.0% | 50.8% | +9.8 | |
| Ohio | D+0.7 | D+1.3 | D+0.6 |
| 50.5% | 56.7% | +6.2 | |
| Wisconsin | D-1.9 | D-0.7 | D+1.2 |
| 29.6% | 43.1% | +13.5 | |
| Governor | |||
| Arizona | D+0.5 | D+1.4 | D+0.9 |
| 52.2% | 60.8% | +8.6 | |
| Kansas | D+3.2 | D+4.1 | D+0.9 |
| 58.5% | 63.8% | +5.1 | |
| Nevada | D+0.1 | D+1.0 | D+1.1 |
| 53.9% | 60.2% | +6.3 | |
| Oregon | D+0.1 | D+0.3 | D+0.2 |
| 54.6% | 55.9% | +1.3 | |
| Wisconsin | D+0.7 | D+1.9 | D+1.2 |
| 56.9% | 68.5% | +11.6 | |
| TOTAL Senate | D-0.9 | D+0.0 | D+0.9 |
| 41.6% | 49.9% | +8.3 | |
| TOTAL Governor | D+0.9 | D+1.7 | D+0.9 |
| 55.2% | 61.8% | +6.6 | |
| OVERALL | D-0.1 | D+0.8 | D+0.9 |
| 47.8% | 55.3% | +7.5 |
Readjusting how I adjust for partisan pollster bias increases Democratic margins 0.9 points, on average, with a corresponding 7.5-point increase in the probability the Democrat wins; this results in a Democratic net gain of 0.4 additional Senate seats and 0.3 additional governor’s mansions. Both margin and win percentage increased in all 11 elections, albeit only slightly in the three-way Oregon gubernatorial election, which already skews 0.7 points Republican. The largest gains, meanwhile, were in the two Wisconsin elections, with both Democrats jumping 1.2 points for a mean 12.5-point increase in their win probability.
I had honestly intended to alter how I adjust polls for partisan bias based upon this analysis, but having learned that I am already discounting Democrats by an amount very close to the historic average, I will continue to use the same methods – with one exception described below.
***********
The House. As of October 2, 2022, I estimate Democrats lead Republicans on the generic ballot by 0.3 points, 44.2% to 43.9%. Based upon this value, I estimate the probability Democrats retain a House majority is 28.6%. This is an increase of 2.0 points in one week. I also estimate Democrats will lose 9.9 seats, putting them at 212 (compared to the 222-213 majority they held following the 2020 elections), with a 95% confidence interval of -31.5 to +11.2.
Using only the 44 generic ballot polls conducted entirely after Labor Day, though, Democrats lead by 1.3 points, which equates to a 39.6% chance of retaining their House majority and an average loss of 6.6 seats (95% CI: -28.2 to +14.5). For Democrats to be nominal favorites to retain their House majority (p>50%), they need to win nationally by ≥2.3 points.
These probability and seat estimates are well in line with those from FiveThirtyEight.com, whose probabilities range from 32% (Deluxe) to 40% (Classic), with 212 seats assigned >50% probability of being won by the Democrat in the methodologically-conservative Deluxe model. However, if Democrats win every seat with probability>43%, they maintain a bare House majority across all three models.
Bottom line: A narrow House Republican majority remains a bit more likely than not, though Democrats’ position steadily improves.
***********
The Senate. As of October 2, 2022, 271 publicly-available Senate election polls have been conducted since November 1, 2021. These include five polls assessing a final matchup between two Republicans in Alaska: incumbent Senator Lisa Murkowski and former state official Kelly Tshibaka; Murkowski edges Tshibaka 51.7% to 48.3%. Only the Senate elections in California, Hawaii and Oregon – which incumbent Democrats Alex Padilla, Brian Schatz and Ron Wyden, respectively, are near-locks to win – and in Alabama, Idaho and North Dakota – which Republicans Katie Britt, Michael Crapo and John Hoeven, respectively, are near-locks to win – do not yet have publicly-available polling.
Table 2 shows updated projections for all 35 Senate elections.
Table 2: Democratic Senate win probabilities and projected final margins, 2022
| State | Fundamentals | Polling (WAPA) | Poll Wt | Final Projection | |||
| Democratic seat | Margin | P(D win) | Margin | P(D win) | Margin | P(D win) | |
| Hawaii | 34.8 | 100.0% | n/a | n/a | n/a | n/a | 100.0% |
| Vermont | 29.2 | 100.0% | 14.2 | 100.0% | 0.86 | 16.3 | 100.0% |
| Maryland | 32.0 | 100.0% | 23.0 | 100.0% | 0.72 | 25.5 | 100.0% |
| California | 27.1 | 100.0% | n/a | n/a | n/a | n/a | 100.0% |
| New York | 26.0 | 100.0% | 21.0 | 100.0% | 0.92 | 21.3 | 100.0% |
| Connecticut | 19.7 | 99.6% | 14.2 | 100.0% | 0.89 | 14.8 | 100.0% |
| Washington | 19.5 | 99.6% | 9.4 | 100.0% | 0.96 | 9.8 | 100.0% |
| Illinois | 19.1 | 99.5% | 17.4 | 100.0% | 0.83 | 17.7 | 99.9% |
| Oregon | 15.9 | 98.4% | n/a | n/a | n/a | n/a | 98.4% |
| Colorado | 11.5 | 93.5% | 8.7 | 98.0% | 0.87 | 9.1 | 97.4% |
| New Hampshire | 7.0 | 78.0% | 8.2 | 100.0% | 0.87 | 8.1 | 97.2% |
| Nevada | 5.3 | 73.1% | -0.2 | 48.4% | 0.85 | 0.7 | 52.2% |
| Arizona | -4.0 | 40.1% | 6.9 | 99.9% | 0.86 | 5.4 | 91.5% |
| Georgia | -4.4 | 38.7% | 1.8 | 75.3% | 0.87 | 0.9 | 70.4% |
| Estimated Democratic seats lost = 0.9 (range = 0.4 to 1.4)* | |||||||
| Republican seat | |||||||
| Pennsylvania | -2.0 | 47.4% | 6.6 | 100.0% | 0.87 | 5.4 | 93.0% |
| Wisconsin | -5.4 | 35.0% | -1.9 | 29.3% | 0.94 | -2.1 | 29.6% |
| Florida | -8.5 | 25.0% | -4.7 | 1.3% | 0.80 | -5.5 | 6.0% |
| North Carolina | -5.5 | 34.8% | -0.9 | 41.9% | 0.87 | -1.5 | 41.0% |
| Ohio | -9.5 | 22.3% | 0.7 | 56.8% | 0.82 | -1.2 | 50.5% |
| Iowa | -12.8 | 14.1% | -7.6 | 0.5% | 0.85 | -8.4 | 2.6% |
| Alaska | -18.8 | 5.1% | n/a | n/a | n/a | n/a | 0.0% |
| South Carolina | -18.9 | 5.0% | -18.5 | 0.0% | 0.74 | -18.6 | 1.3% |
| Missouri | -18.7 | 5.3% | -12.0 | 0.1% | 0.97 | -12.2 | 0.3% |
| Indiana | -22.6 | 2.4% | -2.3 | 42.4% | 0.78 | -6.7 | 33.7% |
| Kansas | -24.3 | 1.6% | -14.9 | 0.0% | 0.75 | -17.2 | 0.4% |
| Louisiana | -25.3 | 1.3% | -21.4 | 0.0% | 0.74 | -22.4 | 0.3% |
| Utah | -30.6 | 0.3% | -10.0 | 1.1% | 0.77 | -14.7 | 0.9% |
| Alabama | -28.9 | 0.5% | n/a | n/a | n/a | n/a | 0.5% |
| South Dakota | -32.6 | 0.2% | -16.8 | 5.5% | 0.83 | -19.4 | 4.6% |
| Kentucky | -33.3 | 0.1% | -15.5 | 0.0% | 0.42 | -25.8 | 0.1% |
| Arkansas | -33.3 | 0.1% | -12.8 | 22.5% | 0.76 | -17.8 | 17.1% |
| Idaho | -37.8 | 0.0% | n/a | n/a | n/a | n/a | 0.0% |
| North Dakota | -38.4 | 0.0% | n/a | n/a | n/a | n/a | 0.0% |
| Oklahoma (1) | -40.8 | 0.0% | -20.9 | 0.0% | 0.76 | -25.7 | 0.0% |
| Oklahoma (2) | -40.8 | 0.0% | -16.1 | 0.0% | 0.76 | -22.1 | 0.0% |
| Estimated Republican seats lost = 2.9 (range = 2.1 to 4.5) | |||||||
| Overall expected Democratic seats gained/lost = +1.9 (range = +0.7 to +4.2) |
*Adding 4 or subtracting 2 points to all WAPA, including generic ballot estimates
Italics indicate open seats, while boldface indicates a likely “flip.” “Fundamentals” is the sum of state’s partisan lean (3W-RDM), current generic ballot estimate (D+0.3) and incumbency advantage (Senate values: 5.5 points for Democrats, 3.3 points for Republicans); I assign one-third incumbency advantage to Democrats Mark Kelly of Arizona and Raphael Warnock of Georgia because they first won their seats in 2020 special elections. Essentially, this is what one would expect the Democratic margin to be for a generic Democratic vs. a generic Republican. The “fundamentals” probability the Democratic candidate wins is the likelihood of a Democratic margin of ≥0.0000001 given a normal distribution, with mean of +1.3 (mean historic “miss”) and standard deviation of 10.7.
Despite improvement on the generic ballot, “on paper,” Kelly and Warnock are modest underdogs, while Democratic incumbents in New Hampshire and Nevada are only modest favorites. On the flip side, the open Republican seat in Pennsylvania – vacated after two terms by Pat Toomey – is essentially a toss-up, albeit with the Republican candidate slightly favored. On average, I now give 18% weight to fundamentals and 82% weight to WAPA, an increase of WAPA weight of 3.0 points in one week.
Recall these categories:
Safe Republican (<5%)
Solid Republican (≥5 to <10%)
Likely Republican (≥10 to <20%)
Lean Republican (≥20 to <30%)
Tilt Republican (≥30 to <40%)
Toss-up (≥40 to ≤60%)
Tilt Democratic (>60 to ≤70%)
Lean Democratic (>70 to ≤80%)
Likely Democratic (>80 to ≤90%)
Solid Democratic (>90 to ≤95%)
Safe Democratic (>95%)
The difference between “Safe” and “Solid” is not especially illuminating for Republicans, so let us combine them:
Safe/Solid Republican (n=13). Incumbents Crapo, Hoeven, John Kennedy (LA), Jim Lankford (OK), Jerry Moran (KS), Rand Paul (KY), Tim Scott (SC) and John Thune (SD) are near-locks to win. Republican nominees Britt, Markwayne Mullin and Eric Schmitt are also prohibitive favorites to win open seats in Alabama, Oklahoma and Missouri, respectively. Republican Senator Mike Lee is heavily favored – for now – to defeat Independent former CIA operative Evan McMullin (effectively the Democratic nominee) in Utah, while I project Murkowski has the edge over Tshibaka.
Likely Republican (n=4). Two polls have been conducted in the Indiana Senate election between Republican incumbent Todd Young and Democratic Hammond Mayor Thomas McDermott, Jr. These mediocre (B-/C+) polls, one skewed Democratic and one skewed Republican, suggest Young leads McDermott by only 2.3 points, when he “should” be winning by more than 20 points. Moreover, neither candidate tops 42% on average, which combined with Libertarian candidate James Sceniak (6% in the most recent poll) suggests extreme volatility – which is why McDermott has a 33.7% chance to win (up from 15.0% last week). While this could be a sign of a Democratic surge – along with a single poll in Arkansas suggesting trouble for Republican incumbent John Boozman – it is far more likely just a handful of mediocre polls not pushing undecideds hard enough. Both Boozman and Young should win by double digits.
Meanwhile, incumbents Chuck Grassley in Iowa and Rubio in Florida face strong challenges from retired United States Navy Vice Admiral Michael Franken Demings, respectively. Based solely on the fundamentals, Iowa is Likely Republican, which Franken trailing by 7.6 points tends to confirm. Grassley just turned 89 years old, though, so he could yet stumble due to age.
On paper, Florida’s Senate contest is Lean Republican, which Rubio leading overall by 4.7 points supports. However, Demings has gained substantial ground. In 10 polls conducted through July 1, Demings trailed by 8.8 points, 37.0% to 45.8%, with an unusually-high 17.2% choosing neither candidate. But on June 24, the United States Supreme Court overturned the nationwide right to an abortion, sending the issue back to state legislatures to decide – and galvanizing Democratic voters. In the 18 polls conducted since then, Demings has trailed by 4.1 points, 44.0% to 48.0%, an astonishing 4.7-point shift overall apparently fueled by “committing voters” breaking roughly 7-2 for Demings. Rubio is still the strong favorite to win, but if Demings continues to attract these voters at this rate, this could be a very close election.
Lean Republican (n=0).
Tilt Republican (n=1). And now some bad news for Democrats: two-term Wisconsin Republican Ron Johnson is now the modest favorite to win reelection, in line with “Tilt Republican” fundamentals. Johnson has increased his lead over Democratic Lieutenant Governor Mandela Barnes to 1.9 points, 46.6% to 48.5%, in 14 polls (B+/A-). And in the 10 polls released since Labor Day (B+), Barnes trails by 2.5 points – 46.2% to 48.8% – after having led by 3.5 points in polls averaging A-.
Toss-ups (n=3). On paper, Republicans should be modest favorites to retain the Senate seats being vacated by Richard Burr in North Carolina (R+5.8) and Rob Portman in Ohio(R+9.8). However, both races are toss-ups that moved slightly toward Democrats since last week. In North Carolina, former State Supreme Court Chief Justice Cheri Beasley is within 0.9 points of House member Ted Budd – though she trails by 1.9 points in six polls conducted since Labor Day (B/B-). That said, Budd only averages 46.1% since Labor Day, making this election extremely competitive.
Meanwhile, in Ohio, Democratic House member Tim Ryan leads Republican venture capitalist J.D. Vance 45.1% to 44.5%. Moreover, Ryan has closed the gap to just 0.8 points in polls rated at least B+ (n=7), with Vance’s average dropping to 45.0% – and only trails by 0.3 points in seven polls conducted since Labor Day. This election truly could not be any closer, though Republicans should be very nervous that the Republican nominee in a Republican state continues to struggle to top 45%.
In Nevada, finally, Democratic Senator Catherine Cortez Masto is essentially tied with Republican former state Attorney General Adam Laxalt overall (19 polls, B-/B), 43.9% to 44.1%. However, these values mask a sharp Republican shift in the polls, mirroring Wisconsin. After leading by 2.8 points in 14 polls conducted through Labor Day, Cortez Masto 2.2 points in five polls (B+/B) conducted since then, 43.1% to 45.3%. Cortez Masto’s inability to top 45% at any point should make Democrats very nervous, despite my projection she will win by 0.7 points, unchanged since last week.
The good news for Democrats is that Republicans average only 45.5% of the vote since Labor Day in three states averaging R+5.4, meaning quite a few nominally Republican voters are hesitating to commit to the Republican candidate. This does not mean they will ultimately vote Democratic, of course, just that there is an opening for Democrats to make a strong closing argument.
Tilt Democratic (n=0).
Lean Democratic (n=1). Warnock leads former National Football League player Herschel Walker 47.1% to 45.3% overall, and 47.0% to 45.5% in eight polls conducted since Labor Day (B+/B average). Essentially, the race is frozen in place, as Walker, like Budd, Laxalt and Vance, struggles to top 46%. This is good news for Warnock. However, Georgia is still a Republican-leaning state (R+6.5) and with third-party candidates earning 3-4 points in some polls, a runoff occasioned by neither candidate winning a majority on Election Day remains a strong possibility. If the race goes to a January runoff, FiveThirtyEight.com projects Walker to win an average 66% of the time, down slightly from last week.
Likely Democratic (n=1). The Senate seat most likely to change partisan hands is that held by retiring Republican Pat Toomey in Pennsylvania. Democratic Lieutenant Governor John Fetterman leads Republican television celebrity Dr. Mehmet Oz overall 48.3% to 41.7% (n=27, B). However, Fetterman’s stroke and some consolidation of Republican voters by Oz are likely why the race has tightened a bit: in nine polls (B+) conducted since Labor Day, Fetterman leads 47.4% to 43.5%, a 1.6-point drop for Fetterman and a 4.4-point increase for Oz. That said, Oz is still ONLY at 43.5% – and remains a 4-1 underdog looking only at post-Labor-Day polls; Fetterman is projected to win by 3.4 points in this scenario.
Solid Democratic (n=1). Some Arizona (R+6.1) voters may have drifted from supporting Democratic Senator Mark Kelly to nominally undecided, but he still tallies 48.0% in 10 polls (B+/B) conducted since Labor Day – while Republican capitalist Blake Masters remains stuck at a dismal 41.7%. Look for Kelly to win by between five and six points.
Safe Democratic (n=12): Incumbents Michael Bennet (CO), Richard Blumenthal (CT), Tammy Duckworth (IL), Maggie Hassan (NH), Patty Murray (WA), Padilla, Chuck Schumer (NY), Schatz, Chris Van Hollen (MD) and Wyden (OR) are near-locks to win reelection. Murray was effectively reelected on August 2, when she won 52.3% of the vote in an all-candidate primary; all Democrats combined won just under 55% of the vote. Meanwhile, House member Peter Welch is all-but-certain to win the Vermont Senate seat being vacated by seven-term Democrat Pat Leahy.
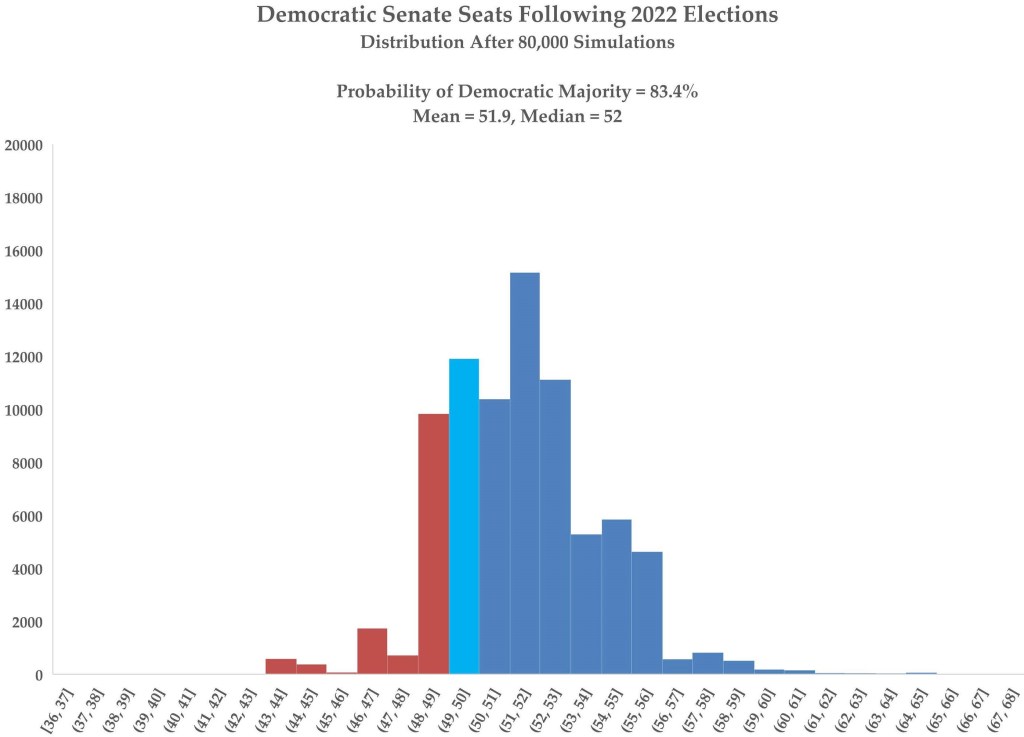
Bottom line: There is an 83.4% chance Democrats hold at least 50 Senate seats – and thus maintain the majority. In fact, there is a 67.9% chance Democrats net add Senate seats, with two being the most likely outcome (18.9%). While these are slight increases from last week, I would not read much into it given the weird polling in Indiana. Moreover, there is a 12.3% chance Democrat net lose one seat, giving Republicans a narrow 51-49 majority. Overall, there is an 72.9% chance Democrats land between a net loss of one and a net gain of three Senate seats, for an over/under of +1.5.
Figure 1: 2022 Senate election distribution
***********
Governors. As of October 2, 2022, 301 publicly-available gubernatorial election polls have been conducted since November 1, 2021. Only those in the open seat in Hawaii – which Democrat Josh Green is a near-lock to win – and in Alabama, Idaho, Nebraska, South Dakota, Tennessee, and Wyoming – which Republicans Kay Ivey, Brad Little, Jim Pilllen, Kristi Noem, Bill Lee and Mark Gordon, respectively, are near-locks to win – do not yet have publicly-available polling.
A net gain of three governor’s mansions by Democrats would give them 25, giving them parity for the first time since 2010. Table 3 shows updated values for all 36 gubernatorial elections in 2022.
Table 3: Democratic gubernatorial win probabilities and projected final margins, 2022
| State | Fundamentals | Polling (WAPA) | Poll Wt | Final Projection | |||
| Democratic seat | Margin | P(D win) | Margin | P(D win) | Margin | P(D win) | |
| Hawaii | 29.3 | 94.1% | n/a | n/a | n/a | n/a | 94.1% |
| California | 35.6 | 97.1% | 26.5 | 100.0% | 0.83 | 28.0 | 99.5% |
| New York | 20.5 | 86.2% | 13.4 | 100.0% | 0.85 | 14.4 | 97.9% |
| Rhode Island | 22.1 | 88.0% | 24.7 | 100.0% | 0.74 | 24.0 | 96.9% |
| Connecticut | 24.6 | 90.4% | 13.0 | 100.0% | 0.93 | 13.7 | 99.4% |
| Illinois | 24.0 | 89.9% | 12.6 | 100.0% | 0.80 | 14.9 | 98.0% |
| Oregon | 10.4 | 70.9% | 0.1 | 50.3% | 0.79 | 2.2 | 54.6% |
| New Mexico | 17.0 | 81.6% | 6.1 | 88.4% | 0.96 | 6.6 | 88.1% |
| Colorado | 16.4 | 80.7% | 13.1 | 100.0% | 0.87 | 13.5 | 97.5% |
| Maine | 15.2 | 78.9% | 10.2 | 100.0% | 0.81 | 11.1 | 95.9% |
| Minnesota | 12.5 | 74.6% | 7.6 | 99.6% | 0.97 | 7.7 | 98.7% |
| Nevada | 10.2 | 70.5% | 0.1 | 50.9% | 0.85 | 1.7 | 53.9% |
| Michigan | 10.0 | 70.2% | 11.1 | 100.0% | 0.82 | 10.9 | 94.7% |
| Pennsylvania | -2.0 | 45.5% | 9.5 | 100.0% | 0.89 | 8.2 | 93.8% |
| Wisconsin | 8.3 | 66.9% | 0.7 | 56.3% | 0.94 | 1.2 | 56.9% |
| Kansas | -10.6 | 28.4% | 3.2 | 65.7% | 0.81 | 0.6 | 58.5% |
| Estimated Democratic seats lost = 2.2 (range = 1.3 to 2.8)* | |||||||
| Republican seat | |||||||
| Vermont | 15.3 | 79.2% | -49.9 | 0.0% | 0.86 | -40.7 | 11.1% |
| Maryland | 26.5 | 92.1% | 27.7 | 100.0% | 0.92 | 27.6 | 99.4% |
| Massachusetts | 26.4 | 92.0% | 23.3 | 100.0% | 0.91 | 23.6 | 99.3% |
| New Hampshire | -12.4 | 25.2% | -18.3 | 0.0% | 0.86 | -17.5 | 3.4% |
| Florida | -19.1 | 15.2% | -5.7 | 0.0% | 0.81 | -8.3 | 2.9% |
| Arizona | -5.8 | 37.6% | 0.5 | 54.0% | 0.89 | -0.2 | 52.2% |
| Georgia | -13.0 | 24.1% | -5.7 | 0.0% | 0.87 | -6.7 | 3.2% |
| Iowa | -23.4 | 10.5% | -14.5 | 0.0% | 0.84 | -16.0 | 1.7% |
| Ohio | -23.4 | 10.5% | -15.3 | 0.0% | 0.88 | -16.3 | 1.2% |
| Texas | -25.6 | 8.5% | -7.3 | 0.0% | 0.85 | -9.9 | 1.2% |
| Alaska | -29.4 | 5.7% | -10.6 | 0.0% | 0.81 | -14.2 | 1.1% |
| South Carolina | -29.5 | 5.7% | -7.3 | 0.0% | 0.76 | -12.5 | 1.4% |
| Nebraska | -24.8 | 9.2% | n/a | n/a | n/a | n/a | 9.2% |
| Tennessee | -40.8 | 1.4% | n/a | n/a | n/a | n/a | 1.4% |
| Alabama | -42.8 | 1.1% | n/a | n/a | n/a | n/a | 1.1% |
| South Dakota | -43.2 | 1.0% | n/a | n/a | n/a | n/a | 1.0% |
| Arkansas | -30.0 | 5.4% | -22.0 | 0.0% | 0.80 | -23.5 | 1.1% |
| Idaho | -48.4 | 0.5% | n/a | n/a | n/a | n/a | 0.5% |
| Oklahoma | -51.4 | 0.3% | -10.0 | 0.4% | 0.77 | -19.5 | 0.4% |
| Wyoming | -61.1 | 0.1% | n/a | n/a | n/a | n/a | 0.1% |
| Estimated Republican seats lost = 2.9 (range = 2.7 to 3.6) | |||||||
| Overall expected Democratic seats gained/lost = +0.7 (range = -0.1 to +2.3) |
*Adding 4 or subtracting 2 points to all WAPA, including generic ballot estimates
The gubernatorial incumbency advantages are 10.4 points for Democrats and 13.9 points for Democrats. On average, I now give 15% weight to fundamentals and 85% weight to WAPA, an increase of WAPA weight of 2.0 points since last week.
Safe/Solid Republican (n=16). Incumbents Mike DeWine (OH), Mike Dunleavy (AK), Gordon, Ivey, Lee, Little, Henry McMaster (SC), Noem, Kim Reynolds (IA), Kevin Stitt (OK) and Chris Sununu (NH) are near-locks for reelection. University of Nebraska Board of Regents member Pillen and former White House spokesperson Sarah Huckabee Sanders will be the next Republican governors of Nebraska and Arkansas, respectively.
Meanwhile, Democrats Stacey Abrams (GA), Charlie Crist (FL) and Beto O’Rourke (TX) trail incumbent Republican governors Brian Kemp, Ron DeSantis and Greg Abbott, respectively, by an average 6.2 points. The lowest polling average among the three incumbents is Abbott’s 49.3%, though, making it difficult to see how any of these Democrats win.
Likely Republican (n=1). Popular Republican governor Phil Scott will win reelection, despite Vermont’s D+28.9 status.
Lean Republican (n=0).
Tilt Republican (n=0).
Toss-ups (n=5). Three governors who first won in the 2018 Democratic wave find themselves in a pitched battle for reelection: Laura Kelly in Kansas, Steve Sisolak in Nevada and Tony Evers in Wisconsin. The good news for Kelly in heavily Republican Kansas (R+21.3) is that in two polls conducted at least in part after Labor Day, she leads Schmidt 46.9% to 42.6%, putting her much closer to victory; overall, in four polls, she leads 46.6% to 43.4%. I project her to eke out a narrow victory, though likely closer to three points than 0.6 points.
In Nevada, meanwhile, Sisolak’s lead over Clark County Sheriff Joe Lombardo has shrunk to 43.6% to 43.5% – and he trails 44.5% to 42.9% in three polls (B+/B) conducted since Labor Day. And while I project him to win by about two points, his inability to crack 44% should make Democrats very nervous.
The story is similar in Wisconsin, where Evers’ lead over businessman Tim Michels has dropped to 47.2% to 46.5% overall (n=14, B+), and to just 47.0% to 46.6% since Labor Day (n=9, B+/A-). Evers should win by about one point, but this is a sharp drop from last week.
The open governor’s race in strongly-Democratic Oregon (D+10.3) is a pure toss-up right now because of Independent Betsy Johnson, a former Democratic state senator, and a dearth of quality polling. Only seven polls (B-) have been conducted overall, and they show Democratic former State House Speaker Tina Kotek with 32.2%, Republican former State House Majority Leader Christine Drazan with 31.9% and Johnson with 25.3%. However, in three polls conducted since Labor Day (C+/B-), Drazan leads Kotek 34.4 to 33.0, with Johnson dropping to 17.8%. I had assumed Johnson supporters would shift to Kotek, but the bulk of them appear of have moved to Drazan. Unless Kotek reverses that trend (assuming this is not just an artifact of mediocre polling), her projected 2.2-point victory is very much in doubt.
The open governor’s race in Arizona – the first of three states in which a Democrat is at least even money to replace a retiring Republican governor – is a pure toss-up. Democratic state Attorney General Katie Hobbs is a nominal 52.2% favorite to win in this R+6.1 state, despite a projected 0.25-point loss to television personality Kari Lake. This is yet another state where the Republican candidate has gained ground but still bumps up against a 46% ceiling. In nine polls (B+) conducted since Labor Day, Lake leads 46.2% to 45.9%, though Hobbs still leads overall 46.1 to 45.6%. This election is likely to be decided by less than two points – in either direction.
Tilt Democratic (n=0).
Lean Democratic (n=0).
Likely Democratic (n=1). The only reason New Mexico Democratic Governor Michelle Lujan Grisham is not a solid/safe choice to defeat Republican former meteorologist Mark Ronchetti is that she is averaging 47.1% in seven very high-quality (A- average) publicly-available polls. I project Lujan Grisham to win by mid-to-high single digits.
Solid/Safe Democratic (n=13). The other states which Democrats are near-locks to flip are Maryland and Massachusetts, with both former Army Captain Wes Moore and state Attorney General Maura Healey projected to win by around 25 points. Two other Democratic statewide officials are heavy favorites to win governor’s mansions held by retiring Democrats: Lieutenant Governor Green in Hawaii and Attorney General Josh Shapiro in Pennsylvania.
That leaves nine incumbent Democrats who are at least 9-1 favorites to win reelection: Kathy Hochul (NY), Ned Lamont (CT), Dan McKee (RI), Janet Mills (ME), Gavin Newsom (CA), Jared Polis (CO), J.B. Pritzker (IL), Tim Walz (MN) and Gretchen Whitmer (MI).
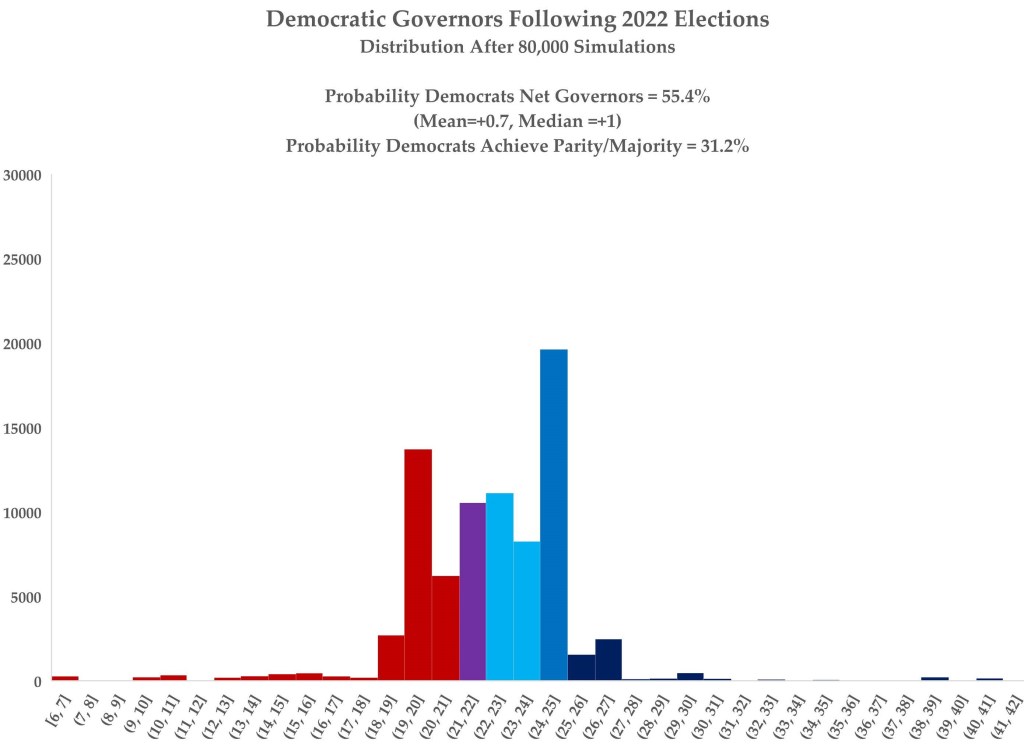
Bottom line: There is a 55.4% chance Democrats net at least one governor, with the most likely outcome (25.4%) being a net gain of three, bringing Democrats to parity for the first time since 2010. These values are down noticeably from last week, primarily due to a correction in how I simulated elections (I was only simulating the “all close races are won by the same party” way). There is also a 24.9% chance Democrats net lose one or two governor’s mansions. Overall, there is an 86.8% chance Democrats land somewhere between a net loss of two and a net gain of three governor’s mansions, for an over/under of +0.5.
Figure 2: 2022 gubernatorial election distribution
***********
While Democrats continue to find themselves in a good position – modest favorites to net Senate seats and governor’s mansions, while limiting losses in the House to ~10 seats – it would only take a polling miss of 3-4 points in Republicans’ favor to flip the script. Note that this represents a 2–3-point Republican shift in my WAPA, which are already adjusted one point toward the GOP. In this scenario, Democrats still gain the Senate seat in Pennsylvania (91.1%), while losing in Nevada (37.7%); Senate control would hinge on Georgia (44.6%) and possibly Ohio (33.7%). Democrats would still win back governor’s mansions in Maryland and Massachusetts, while likely losing in Nevada (40.1%) and Wisconsin (40.8%), with Kansas (50.1%) and Oregon (46.9%) essentially toss-ups. And the likelihood of retaining House control would drop to 9.7%, centered around a loss of 17-18 seats.
However, it is equally plausible Democrats overperform polls by a similar amount – an increase of 4 points relative to my WAPA. In this scenario, Democrats would be favored (72.7%) to retain House control, net gaining about three seats. Not only would Democrats flip Pennsylvania while holding all their Senate seats, they would also add North Carolina, Ohio and Wisconsin for a gain of four seats – with Florida now clearly in play (36.8%). They would still top out at netting three governor’s mansions.
As of early October, though, I still prefer to drive straight down the middle, while awaiting new polling to see whether Republicans continue to top out at 46% or so.
Early voting has already begun in Illinois, Michigan, Minnesota, South Dakota, Vermont, Virginia and Wyoming. All-mail states like Colorado, Oregon and Washington are also voting.
Until next time, please register to vote as soon as you can if you have not already done so. And if you like what you read on this website, please consider making a donation. Thank you.


3 thoughts on “2022 Elections Update: Should I adjust my adjustments?”