In May 2017, I launched the “A Wicked Early Look” series with an assessment of Democrats’ 2018 election United States Senate (“Senate”) prospects. The next month I wrote an analogous essay about the gubernatorial elections later that November and in 2018. Borrowing a concept from FiveThirtyEight.com forecasting models, I began to calculate what I call an election’s “fundamentals”: a baseline for how an election will go in the absence of polling data. It is the sum of three values:
State partisan lean: How much more or less Democratic a state typically votes in a neutral political environment. I assess this using 3W-RDM. The 3W-RDM for Wisconsin is -2.4, meaning that a generic Republican would beat a generic Democrat by 2.4 percentage points (“points”), on average, if the two major parties were tied nationally. New Hampshire, meanwhile, has 3W-RDM=1.2, making it about 3.6 points more Democratic than Wisconsin.
Incumbency: Incumbents seeking reelection usually get a higher share of the vote than a non-incumbent of the same party. Wisconsin Senator Ron Johnson, a Republican, seeks reelection in 2022. I estimate he would outperform another Republican by 3.3 points. Also seeking reelection in 2022 is Democratic Senator Maggie Hassan of New Hampshire. I estimate she would outperform another Democrat by 5.5 points.
National political environment: This is which political party has “the edge” nationally. While there are a number of valid ways to measure this, only one is not dependent upon election results, which may become outdated quickly: the “generic ballot” (“GB”) question: If an election were held today, would you vote for the Democratic candidate, the Republican candidate, some other candidate, or have you not yet decided?
As of March 9, 2022, I estimate Republicans are ahead on this question by 0.8 points, 43.1 to 43.9%, with the remaining 13.0% undecided or planning to vote for a third-party candidate (“Undec/3rd”). This suggests that if Senate elections were held today, Johnson would beat a generic Wisconsin Democrat by about 6.5 points, while Hassan would beat a generic New Hampshire Republican by about 5.9 points. Caveat emptor: there is enough uncertainty in these estimates that I would put each Senator in the “lean” category – and, remember, this is without taking into account publicly-available polling, which is still very sparse eight months prior to an election.
**********
I calculate my GB estimate using the 196 such polls released publicly since February 2021. Table 1 lists the 48 individual pollsters who have assessed the GB question during this period, along with their pollster rating and arithmetic partisan bias.[1]
Table 1: Pollsters Assessing the Generic Ballot Question, February 2021 to March 2022
| Pollster | # Polls | Rating | Bias |
| YouTube weekly tracking | 45 | B+ | D+0.7 |
| Morning Consult weekly tracking | 22 | B | D+2.9 |
| Echelon Insights | 15 | B/C | D+0.1 |
| RMG Research | 15 | B- | D+3.5 |
| McLaughlin & Associates | 10 | C/D | R+1.6 |
| Quinnipiac | 6 | A- | D+0.5 |
| YouTube non-tracking | 6 | B+ | D+0.7 |
| Ipsos (Adults only) | 5 | B- | D+1.6 |
| Harris Poll | 4 | B+ | R+1.1 |
| NBC News | 4 | B+ | D+0.8 |
| Rasmussen Reports/Pulse Opinion Research | 4 | B | R+1.5 |
| The Winston Group | 4 | A/B | R+1.2* |
| Change Research | 3 | B- | D+2.9 |
| Fox News | 3 | A | D+1.8 |
| Marist College | 3 | A | D+0.1 |
| OnMessage Inc. | 3 | B/C | R+2.6 |
| SSRS | 3 | C | D+2.7 |
| Suffolk University | 3 | B+ | D+0.9 |
| ABC News/The Washington Post | 2 | A+ | D+0.9 |
| CNBC/Hart Research/Public Opinion Strategies (Adults only) | 2 | B+ | D+2.1 |
| Cygnal | 2 | B+ | D+2.1 |
| Emerson College | 2 | A- | D+0.8 |
| GQR Research | 2 | B | D+2.1 |
| Insider Advantage | 2 | B | D+1.1 |
| PEM Management Corporation | 2 | C+* | R+3.5* |
| Public Opinion Strategies | 2 | A- | R+2.0* |
| Susquehanna Research & Polling Inc. | 2 | B+ | D+0.6 |
| Trafalgar Group | 2 | A- | R+2.4* |
| Zogby Analytics | 2 | B- | R+0.7 |
| 16 Pollsters | 1 | B- | D+0.3 |
| TOTAL/AVERAGE | 196 | B/B- | D+0.2 |
Thus far, 44 separate pollsters have conducted at least one GB poll since February 2021; I explain the second YouTube entry below. Overall, they average a B/B- rating and a Democratic “bias” of 0.2 points – broadly in line with recent elections for which I calculated a polling average.
Following FiveThirtyEight, I assigned unrated pollsters a C+ and assumed no skew. Five of the 16 pollsters with only one assessment fall into this category; one – National Republican Senatorial Committee – I gave the maximum skew of R+3.5. I excluded the other four when calculating average rating in Table 1.
If a rated pollster conducted a poll on behalf of a Democratic or Republican candidate or organization, I used the average of that pollster’s partisan bias and -3.5 or 3.5, respectively, for that poll. Four asterisked pollsters in Table 1 conducted all of their polls for a Republican candidate or group.
A total of 16 pollsters have conducted only one GB poll, while 11 pollsters conducted two, six conducted three and four conducted four. Only Ipsos, Quinnipiac, McLaughlin & Associates, RMG Research, Echelon Insights, Morning Consult and YouGov (51 total) conducted as many as five GB polls. These seven pollsters average a similar B/B- as the other 37 pollsters in Table 1, but have a much sharper Democratic bias of 1.1 points, on average.
Moreover, one of every three polls are weekly tracking polls conducted by YouGov for The Economist (45) or by Morning Consult for Politico (22); they have a decent B+/B average but, thanks to Morning Consult’s D+2.9, a mean Democratic bias of 1.8.
Does this matter?
**********
Just bear with me while I review how I calculate a weighted-adjusted polling average, or WAPA. First, to each polling margin (Democratic percentage minus Republican percentage) I add the pollster’s partisan bias, subtracting for D+x and adding for R+x. I then weight this adjusted margin by field date midpoint[2] and pollster rating.[3] I also give only 50% weight to any poll sampling adults only (vote preference is meaningless if one is unregistered) and/or conducted over one day only (longer field dates help to ensure truly representative samples).
In other words, for every poll I calculate this value:
Poll Value = (Democratic Margin + Partisan Bias)*Time Weight*Pollster Rating Weight*0.50 (if adults only/one day)
I then sum the values and divide by the sum of the product of time and pollster rating weights (and 50% when applicable).[4]
For a polling aggregation to be valid, however, the polls being combined must be statistically independent, meaning there is no relation between them. Polls conducted by the same pollster are NOT statistically independent – the identical methodology is used in every poll, possibly leading to systematic bias (i.e., a tendency to miss “true” values by a constant amount). This is why I always calculate two versions of WAPA: one using all polls in the field regardless of pollster and one which calculates a single WAPA for each pollster. Over more than 100 elections analyzed, the two WAPA’s have always differed by ≤0.5 points – a negligible difference.
As of March 9, 2022, however, the “all polls” WAPA shows Democrats ahead on the GB a negligible 0.1 points while the “single pollster” WAPA shows Republicans ahead by 1.6 points – an alarming 1.7-point gap!
***********
Why is there such a large discrepancy?
Table 2 suggests the likeliest explanation.
Table 2: Estimated Generic Ballot Margin as of March 9, 2022, Calculated Two Ways, By Poll Set
| Set of Polls | All Polls | Single Pollster | Mean |
| All Polls | D+0.1 | R+1.6 | R+0.8 |
| YouTube weekly tracking | D+4.9 | n/a | D+4.9 |
| Morning Consult weekly tracking | R+1.3 | n/a | R+1.3 |
| All Other Pollsters | R+1.5 | R+1.7 | R+1.6 |
Since YouGov conducted its first weekly tracking poll of the generic ballot question from April 17-20, 2021, it has consistently shown Democrats performing about six points better than all other pollsters, including Morning Consult. The latter began to track this question weekly – and over mostly the same days of the week as YouGov – September 10-13, 2021. With 67 tracking polls thus far, these two pollsters – especially YouGov – are the leading drivers of the “all polls” WAPA. Figure 1 summarizes these values over time, using either a five- (Morning Consult, YouGov) or 10-poll rolling WAPA.
Figure 1:

Regardless of which polls are used, the early Democratic GB advantage has declined steadily over time – excepting a sharp uptick in September 2021. There was an especially steep decline just prior to the 2021 Elections, in which Democratic candidates underperformed. While Democrats recovered nearly all of the decline the following month, their position has been eroding every since, albeit with a hint of a rebound lately. While the Morning Consult tracking polls have followed a similar path, YouGov has shown a consistent four-point lead (after adjusting for partisan bias) since late November 2021.
So…which set of data are correct, YouGov or everybody else, including Morning Consult?
The answer: it all depends how you treat respondents who initially choose an option other than Democrat or Republican, as Table 3 shows.
Table 3: Estimated Democratic, Republican and Undec/3rd Percentages on Generic Ballot as of March 9, 2022, By Poll Set
| Set of Polls | Democrat | Republican | Undec/3rd |
| All Polls | 43.1% | 43.9% | 13.0% |
| YouTube weekly tracking | 43.2% | 38.3% | 18.5% |
| Morning Consult weekly tracking | 41.6% | 42.9% | 15.5% |
| All Other Pollsters | 43.0% | 44.6% | 12.4% |
On average, the percentage of respondents planning to vote for the Democratic candidate differs little by polling subset, ranging between 41.6% and 43.2%. However, YouGov polls consistently show a much lower percentage planning to vote for the Republican candidate: 38.3% vs. ~44%. YouGov – and, to a lesser extent, Morning Consult – tracking polls also show a higher percentage not choosing either the Democratic or the Republican candidate.
From my brief, less-than-pleasant experience as someone who called randomly-selected telephone numbers on behalf of a polling firm, I know respondents who initially waver on a response to a forced-choice question are asked at least one more time to choose. This tells me YouGov and Morning Consult are not pushing “undecided” voters – and, historically speaking, all but about 1.5% are truly undecided – as hard to make a choice as other pollsters. I cannot speak to why that is, other than to say that each pollster makes its own strategic decisions.
Figures 2 and 3 reveal the impact of “pushing” Undec/3rd respondents to choose a major party candidate:
Figure 2:
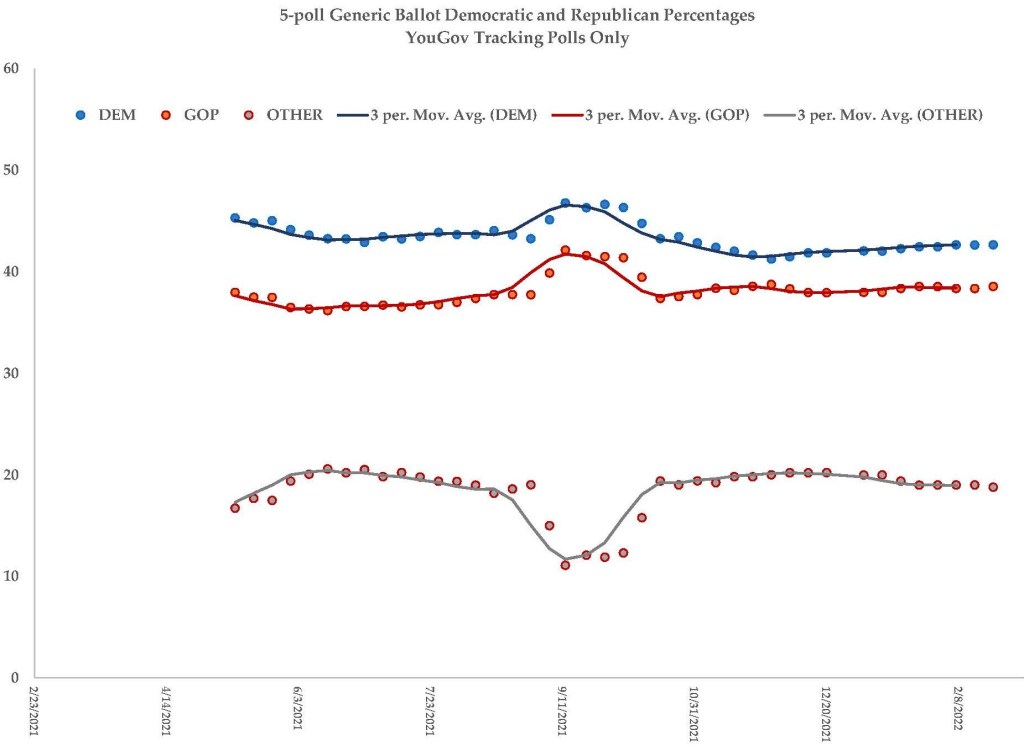
Figure 3:

Compared to all other pollsters since May 2021, YouGov has consistently reported nearly 20% Undec/3rd – with one dramatic exception: mid-August to mid-October 2021, when it dropped from a prior average of 19.2% to a 10-week average of 13.0%; it has averaged 19.5% since then. Over that same period, the percentage choosing the Democratic candidate increased 2.2 points to 46.0%, while the percentage choosing the Republican candidate increased 4.0 points to 41.0%.[5] This is nearly a 2-1 break for the Republican candidate, although Democrats still led by an average 5.0 points.
This tracks with Figure 2: when the percentage Undec/3rd declined sharply, the percentage choosing the Republican candidate increased equally sharply. In fact, the Pearson correlation (“r”) between the two percentages – using all 196 polls – is -0.81, meaning that as one rises, the other falls nearly all of the time; when pushed, Undec/3rd respondents who make a choice, overwhelmingly choose the Republican candidate. By contrast, Democratic percentage is barely affected by changes in Undec/3rd percentage (r=-0.15).
***********
So…who is currently ahead on the generic ballot, and by how much?
The 45 YouGov tracking polls heavily skew the “all polls” WAPA Democratic, implying the “single pollster” measure is more valid at this time. On this latter measure, Republicans lead Democrats on the GB 45.1% to 43.5%, with 11.4% Undec/3rd. This margin of 1.6 is identical to that calculated from the 26 GB polls released since the beginning of February 2022, albeit with a higher Undec/3rd of 14.0%. Moreover, this margin in well in line with the current FiveThirtyEight.com margin of 2.1 points, 42.7% to 44.8%, with 12.5% Undec/3rd.
Looking ahead to November, meanwhile, the prior year of polling suggests 7-10% of potential voters are wavering between Undec/3rd and choosing the Republican candidate, causing wild swings in the latter percentage, while ~43% consistently choose the Democratic candidate. What remains unknown, however, is the behavior of the 11% or so of respondents who have never chosen either major-party candidate. History suggests they are likely to split evenly between Democratic and Republican candidates, or only slightly toward the Republicans. IF the national political environment eight months from now indeed favors Republicans by 1.6 points, Democrats are no worse than even money to retain control of the Senate, while likely suffering no net losses in governor’s mansions. They would still be overwhelming underdogs to lose control of the United States House of Representatives (“House”), with a pro-Republican shift from 2020 House elections of 4.7 points, but one model suggests Democrats could limit their net losses to “only” 16 seats.
The doomsday scenario, of course, is that the remaining Undec/3rd respondents also break 2-1 (or more) Republican. Assuming 1.5% vote for a third-party candidate, this would result in a devastating 4.8-point advantage for the Republicans, at a minimum. This 7.9-point Republican shift equates to a net loss of (at least) 26 House seats, giving the GOP a solid House majority. Democrats could still retain control of the Senate, though it would be an uphill climb. And a net loss of two or more governor’s mansions would not be out of the question.
The Democratic Party thus faces two challenges over the next less-than-eight months. One, try to persuade a small percentage of Republican-leaning voters to switch their vote preference to Democratic. Two, do no worse than break even among the ~11% of generic poll respondents persistently Undec/3rd. I suspect the latter task is a bit easier than the former, if only because history suggests it is. But both mean the difference between a Republican blowout in 2022 and Democrats breathing a modest sigh of relief.
Until next time…please wear a mask as necessary to protect yourself and others – and if you have not already done so, get vaccinated against COVID-19! And if you like what you read on this website, please consider making a donation. Thank you.
[1] On average, how much more Democratic or Republican was a pollster’s results relative to all other pollsters in the same election.
[2] Using an arbitrary starting date – usually January 1 of the election year – I calculate weight as ((days from start) – (days to election))/(days from start).
[3] Using a denominator of 4.3, I denote numerators thus: A+ = 4.3, A=4.0, A-=3.7, etc. Ratings of A/B, B/C and C/D = 3.5, 2.5 and 1.5, respectively.
[4] This is broadly similar to the aggregation method FiveThirtyEight uses, except I do not weight polls by sample size. Increasing precision by sampling more respondents does not equate to greater accuracy; a very precise estimate can still be inaccurate due to systematic bias resulting from the way in which the poll was conducted.
[5] The Democratic and Republican candidates have received the support of 42.3 and 38.2%, respectively, of YouGov tracking poll respondents since then.


10 thoughts on “Tracking the generic ballot polls…and those pesky Undecideds”