On October 24, 2022, I published an updated set of projections for who will have the majority in the United States House of Representatives (“House”) following the 2022 elections, as well as who will win the 35 elections for United States Senate (“Senate”) and 36 elections for governor. Since then, an additional 26 generic ballot polls – which I use to estimate the probability Democrats retain their House majority – have been released, along with 55 new Senate polls and 65 new governor’s race polls.
Last week, I concluded the recent “Republican surge” was about 1/3 polled respondents switching from Undecided/Third Party to Republican and about 2/3 a combination of misperception (confirmation bias, groupthink, institutional incentives, “fighting the last war”) and artifact (pollster overcorrection, Republican-leaning pollsters flooding the zone).
This week I examine three ways in which the landscape is more Democratic-leaning than conventional wisdom suggests.
First, consider the two Senate elections in Georgia in 2020. On Election Day, Democratic journalist Jon Ossoff tallied 47.9% against Republican incumbent David Perdue (49.7%) in one election, while all Democrats combined for 48.4% and all Republicans combined for 49.4% in the other election. With no candidate in either election topping 50%, runoff elections were held on January 5, 2021 between Ossoff and Perdue, and between Democrat Raphael Warnock, pastor of Ebenezer Baptist Church in Atlanta, and appointed Republican incumbent Kelly Loeffler. In the runoff elections, Ossoff won by 1.2 percentage points (“points”) and Warnock won by 2.0 points – meaning both candidates improved by three points relative to Democratic performances on Election Day. Moreover, while turnout was about 9% lower overall, the two Republican nominees lost an average of 142,061 more votes than the Democratic nominees did. These are astonishingly good numbers for Democrats given that Senate control was at stake, and are quite possibly due to Republican President Donald J. Trump being on the ballot on Election Day, but not during the runoffs. Arguably, then, 3.0 points of the polling misses in 2020 (and 2016) resulted from Trump being on the ballot, not a structural flaw in polling methodology.
Two, while FiveThirtyEight.com currently estimates Senate control is essentially a coin flip (52-48 Democratic),[1] their interactive feature suggests this is misleading. By “calling” any of 15 Senate races and 15 House races, one changes the probability of Democratic control. We begin will all Senate elections in which post-Labor-Day polling shows a candidate ahead by six or more points and/or polling ≥49.0%. Going in alphabetical order, we “call” Democrats the winners in Colorado (up to 56%), New Hampshire (66%) and Washington (69%), and Republicans the winners in Florida (down to 66%), Iowa (65%), Louisiana (64%), Missouri (64%) and Wisconsin (back down to 54%). I am also calling Indiana for the Republicans (53%), despite sparse polling.
I realize this is not much of an improvement, but just bear with me. The next most likely Democratic win is in Arizona, where Democratic incumbent Mark Kelly stands at 48.0% and +5.2 in post-Labor-Day polling. In my “doomsday” post-Labor-Day scenario – polls miss by three points in favor of Republicans – he is still a 76.6% favorite. Thus, we now “call” Arizona for Kelly, bumping Democrats’ chances of Senate control to 67%. And then there are House races we can call, starting with Democrat Mary Peltola (AK-AL); to my mind, she is a near-lock to win reelection the same way she won her special election in August. This bumps the value to 72%. Next, we call Democrat Jared Golden (ME-2), mostly on the strength of ranked-choice voting and a strong Democratic nominee for governor at the top of the ticket; this bumps the value to 76% – and a 27% chance Democrats hold the House. Not one of these three calls is controversial, but collectively they turn Democrats from even money to 3-1 favorites. I encourage you to experiment with this feature yourself.
Finally, while it is a mistake to read too much into early voting tallies, they are broadly encouraging for Democrats. According to data collected by University of Florida Michael McDonald, at least 21,174,265 votes have already been cast in the 2022 midterms in 43 reporting states and the District of Columbia. This is 13.4% of the total vote cast for president in 2020 and 18.6% of the total vote cast for House in 2018, the last midterm election. A key driver of midterm election losses for the party controlling the White House is differential turnout – the “in” party feels either complacent and/or disillusioned by the pace of change while the “out” party is determined to vote in opposition. However, not only does turnout appear to be on par with a presidential election year (and with a midterm election in which Democrats won the House vote by more than eight points), registered Democrats comprise 45.2% of the vote in the 22 states reporting registration data. Registered Republicans comprise 33.3%, with the remaining 21.6% registered with neither party. Given the way votes were distributed in 2020, with Democratic votes often cast early while Republican votes were mostly cast on Election Day, it is tempting to conclude the neither-party vote is breaking at least 2-1 Democratic, giving Democrats at least a 20-point lead with about 1/6 of the vote cast. I will refrain, however, for now.
Instead, I note high turnout is in key states, reporting registration edges where available. Georgia, which does not report partisan registration, is leads in early votes cast, tallying 32.7% of the 2020 presidential vote and an eye-polling 41.5% of the 2018 gubernatorial vote! Next is Arizona, at 25.2% of 2020 and 36.0% of the 2018 gubernatorial vote, with all early vote cast by mail. Registered Democrats lead registered Republicans by about 2.8 points, with 23.2% anybody’s guess. That said, registered Democrats and registered Republicans are returning mail ballots at roughly equal rates, possibly reducing the size of an Election Day Republican surge. North Carolina – 20.4% of 2020 and 30.2% of the total House vote in 2018[2] – is also encouraging for Democrats, with registered Democrats leading registered Republicans by 8.1 points, with 29.7% anybody’s guess. Notably, registered Democrats are leading in both early in-person voting AND mail balloting, with roughly equal return rates across all three registration categories. Nevada (21.1%, 30.5%) shows registered Democrats leading registered Democrats by 3.1 points, with 22.4% anybody’s guess. However, there is a more familiar split by vote method, with registered Democrats trailing by 18.7 points in the 38.6% of votes cast in person and leading by 16.9 points in the 61.4% of votes cast by mail. While these tallies are at least somewhat encouraging for Democrats, the one dark spot is Florida (24.0%, 32.4%). Currently, registered Republicans lead registered Democrats 42.3% to 39.1%, with 18.6% anybody’s guess. However, this lead is driven by registered Republicans – who lead by 24.9 points on in person voting (29.2% of early votes) – returning mail ballots at a higher rate (49.4%) than registered Democrats (43.3%). If non-party registrants are breaking 2-1 Republican in person and 2-1 Democratic by mail, Democrats COULD be leading by about 2.4 points, though that is pure speculation – and insufficient to overcome even a modest Republican advantage on Election Day.
Basically, the polls are likely undercounting Democratic strength by a few points, the race for Senate is not really a toss-up, and Democrats should take heart in the early voting tallies.
***********
The House. As of October 30, 2022, I estimate Democrats lead Republicans on the generic ballot by 0.2 points, 44.4% to 44.3%. Based upon this value, I estimate the probability Democrats retain a House majority is 27.1%. This is essentially the same as last week. I estimate Democrats will lose 10.3 seats, putting them at 211 or 212 (compared to 222 following the 2020 elections), with a 95% prediction interval of -32.0 to +10.7.
Using only the 111 generic ballot polls conducted entirely after Labor Day, meanwhile, Democrats lead by 0.05 points, 45.33% to 45.28%, which equates to a 26.1% chance of retaining their House majority and an average loss of 10.7 seats (95% CI: -32.3 to +10.4). These values are, again, down noticeably since last week. For Democrats to be nominal favorites to retain their House majority (p>50%), they need to win nationally by at least 2.3 points.
My estimates continue to diverge from those from FiveThirtyEight.com, whose probabilities range from 19% (Deluxe) to 28% (Classic), with 213 seats assigned >50% probability of being won by the Democrat in the methodologically-conservative Deluxe model. However, if Democrats win every seat with probability≥35%, they maintain a bare House majority across all three models.
Bottom line: A narrow House Republican majority remains more likely than not, with Democrats’ position holding steady this week.
***********
The Senate. As of October 30, 2022, 448 publicly-available Senate election polls have been conducted since November 1, 2021. These include six polls assessing the likely final matchup between two Republicans in Alaska: incumbent Senator Lisa Murkowski and former state official Kelly Tshibaka; Murkowski currently edges Tshibaka 53.2% to 46.8%. Only the Senate elections in Hawaii – which incumbent Democrat Brian Schatz is a near-lock to win – and in Alabama, Idaho and North Dakota – which Republicans Katie Britt, Michael Crapo and John Hoeven, respectively, are near-locks to win – do not yet have publicly-available polling.
Table 2 shows updated projections for all 35 Senate elections. I now weight polls with a field starting October 18 – three weeks prior to Election Day – five times higher. I also limited my polling adjustment for organizational partisan bias (media outlets, websites, foundations) to either -1.75 or +1.75; polling adjustment for candidates, political organizations or political action committees remains either -3.5 or +3.5. Because the average change in margin from registered to likely voters was 2.0 points in 10 generic ballot polls released since Labor Day (September 5) in which both margins were available, I considered adjusted all post-Labor-Day polls of registered voters accordingly, but decided there was genuine uncertainty in such screens, making a mix of the two models possibly more accurate.
Table 2: Democratic Senate win probabilities and projected final margins, 2022
| State | Fundamentals | Polling (WAPA) | Poll Wt | Final Projection | |||
| Democratic seat | Margin | P(D win) | Margin | P(D win) | Margin | P(D win) | |
| Hawaii | 34.7 | 100.0% | n/a | n/a | n/a | n/a | 100.0% |
| Vermont | 29.1 | 100.0% | 22.3 | 100.0% | 0.84 | 23.3 | 100.0% |
| Maryland | 31.9 | 100.0% | 23.0 | 100.0% | 0.70 | 25.7 | 100.0% |
| California | 26.9 | 100.0% | 23.6 | 100.0% | 0.87 | 24.0 | 100.0% |
| New York | 25.9 | 100.0% | 16.0 | 100.0% | 0.96 | 16.4 | 100.0% |
| Connecticut | 19.6 | 99.6% | 12.5 | 100.0% | 0.91 | 13.2 | 100.0% |
| Washington | 19.4 | 99.6% | 7.0 | 100.0% | 0.91 | 8.1 | 100.0% |
| Illinois | 19.0 | 99.5% | 14.0 | 100.0% | 0.88 | 14.6 | 99.9% |
| Oregon | 15.8 | 98.3% | 14.0 | 100.0% | 0.89 | 14.2 | 99.8% |
| Colorado | 11.4 | 93.2% | 9.1 | 100.0% | 0.88 | 9.3 | 99.2% |
| New Hampshire | 6.9 | 77.6% | 5.1 | 99.8% | 0.89 | 5.3 | 97.4% |
| Nevada | 5.2 | 72.6% | 0.1 | 50.9% | 0.86 | 0.8 | 54.3% |
| Arizona | -4.1 | 39.5% | 5.7 | 99.9% | 0.87 | 4.4 | 92.1% |
| Georgia | -4.5 | 38.1% | 1.3 | 64.4% | 0.89 | 0.6 | 61.7% |
| Estimated Democratic seats lost = 1.0 (range = 0.4 to 1.7)* | |||||||
| Republican seat | |||||||
| Pennsylvania | -2.1 | 46.9% | 4.3 | 98.4% | 0.88 | 3.5 | 92.3% |
| Wisconsin | -5.6 | 34.5% | -2.2 | 16.3% | 0.91 | -2.5 | 18.0% |
| Florida | -8.7 | 24.6% | -6.0 | 0.0% | 0.85 | -6.4 | 3.8% |
| North Carolina | -5.6 | 34.3% | -1.9 | 29.0% | 0.89 | -2.3 | 29.6% |
| Ohio | -9.6 | 21.9% | -0.5 | 43.7% | 0.88 | -1.6 | 41.0% |
| Iowa | -13.0 | 13.8% | -9.0 | 0.0% | 0.91 | -9.4 | 1.2% |
| Alaska | -19.0 | 5.0% | n/a | n/a | n/a | n/a | 0.0% |
| South Carolina | -19.1 | 4.9% | -18.5 | 0.0% | 0.72 | -18.7 | 1.4% |
| Missouri | -18.8 | 5.1% | -11.7 | 0.0% | 0.95 | -12.0 | 0.2% |
| Indiana | -22.8 | 2.3% | -2.3 | 42.4% | 0.76 | -7.3 | 32.6% |
| Kansas | -24.5 | 1.5% | -15.5 | 0.0% | 0.73 | -17.9 | 0.4% |
| Louisiana | -25.5 | 1.2% | -23.4 | 0.0% | 0.84 | -23.7 | 0.2% |
| Utah | -30.8 | 0.3% | -8.5 | 1.5% | 0.79 | -13.2 | 1.3% |
| Alabama | -29.0 | 0.5% | n/a | n/a | n/a | n/a | 0.5% |
| South Dakota | -32.8 | 0.2% | -26.2 | 0.0% | 0.87 | -27.0 | 0.0% |
| Kentucky | -33.5 | 0.1% | -15.5 | 0.0% | 0.39 | -26.4 | 0.1% |
| Arkansas | -33.5 | 0.1% | -17.6 | 0.0% | 0.73 | -21.9 | 0.1% |
| Idaho | -38.0 | 0.0% | n/a | n/a | n/a | n/a | 0.0% |
| North Dakota | -38.6 | 0.0% | n/a | n/a | n/a | n/a | 0.0% |
| Oklahoma (1) | -41.0 | 0.0% | -17.9 | 0.0% | 0.77 | -23.3 | 0.0% |
| Oklahoma (2) | -41.0 | 0.0% | -13.4 | 0.0% | 0.77 | -19.8 | 0.0% |
| Estimated Republican seats lost = 2.2 (range = 1.3 to 3.5) | |||||||
| Overall expected Democratic seats gained/lost = +1.3 (range = -0.5 to +3.1) |
*Adding or subtracting 3 points to all WAPA, including generic ballot estimates
Italics indicate open seats, while boldface indicates a likely “flip.” “Fundamentals” is the sum of state’s partisan lean (3W-RDM), current generic ballot estimate (D+0.3) and incumbency advantage (Senate values: 5.5 points for Democrats, 3.3 points for Republicans); I assign one-third incumbency advantage to Democrats Kelly and Warnock because they first won their seats in 2020 special elections. Essentially, this is what one would expect the Democratic margin to be for a generic Democratic vs. a generic Republican. The “fundamentals” probability the Democratic candidate wins is the likelihood of a Democratic margin of ≥0.0000001 given a normal distribution, with mean of +1.3 (mean historic “miss”) and standard deviation of 10.7.
Based solely on the “fundamentals,” Kelly and Warnock are modest underdogs, while Democratic incumbents in New Hampshire and Nevada are only modest favorites. On the flip side, the open Republican seat in Pennsylvania – vacated after two terms by Pat Toomey – is essentially a toss-up, albeit with the Republican candidate barely favored. Two other Republican-held seats – in North Carolina and Wisconsin – tilt Republican. On average, I now give 17% weight to fundamentals and 83% weight to WAPA, unchanged from last week.
Recall these “projection categories”:
Safe Republican (<5%)
Solid Republican (≥5 to <10%)
Likely Republican (≥10 to <20%)
Lean Republican (≥20 to <33%)
Tilt Republican (≥33 to <45%)
Toss-up (≥45 to ≤55%)
Tilt Democratic (>55 to ≤67%)
Lean Democratic (>67 to ≤80%)
Likely Democratic (>80 to ≤90%)
Solid Democratic (>90 to ≤95%)
Safe Democratic (>95%)
The difference between “Safe” and “Solid” is not especially illuminating for Republicans, so we combine them:
Safe/Solid Republican (n=15). Incumbents John Boozman (AR), Crapo, Chuck Grassley (IA), Hoeven, John Kennedy (LA), Jim Lankford (OK), Jerry Moran (KS), Rand Paul (KY), Tim Scott (SC) and John Thune (SD) are near-locks to win. Republican nominees Britt, Markwayne Mullin and Eric Schmitt are also prohibitive favorites to win open seats in Alabama, Oklahoma and Missouri, respectively. Republican Senator Mike Lee is heavily favored – for now – to defeat Independent former CIA operative Evan McMullin (effectively the Democratic nominee) in Utah, while I project Murkowski has the edge over Tshibaka.
Likely Republican (n=2). Two polls have been conducted in the Indiana Senate election between Republican incumbent Todd Young and Democratic Hammond Mayor Thomas McDermott, Jr. These mediocre (B-/C+, using FiveThirtyEight.com pollster ratings) polls, one skewed Democratic and one skewed Republican, suggest Young leads McDermott by only 2.3 points, when he “should” be winning by more than 20 points. Moreover, neither candidate tops 42% on average, which combined with Libertarian candidate James Sceniak (6% in the most recent poll) suggests extreme volatility – which is why McDermott has a roughly one-in-three chance to win.
On paper, Florida’s Senate contest is Lean Republican, which is supported by incumbent Republican Marco Rubio leading overall by 6.0 points (n=35 polls; B-/B), and by 6.1 points in 13 polls conducted since Labor Day (B). Given that Rubio is now at 49.2% since Labor Day, and Democrats appear to lag in the early vote, this seat looks safe for Rubio.
Lean Republican (n=2). Incumbent Republican Johnson is now favored to win reelection in Wisconsin, in line with fundamentals. He still leads Democratic Lieutenant Governor Mandela Barnes 48.8% to 46.8%, in 17 polls (B+), and 49.2% to 46.4% in 13 polls released since Labor Day (B+).
On paper, Republicans are modest favorites to retain the Senate seat being vacated by Richard Burr in North Carolina (R+5.8). Indeed, recent polling suggests Democratic former State Supreme Court Chief Justice Cheri Beasley has lost ground against House member Ted Budd, trailing now by 1.9 points (43.8% to 45.6%). Moreover, she trails by 2.3 points in 13 polls conducted since Labor Day (B+/B). That said, Budd only averages 46.2% in these polls, with about 1.6 points for other candidates, meaning if Beasley wins undecided voters a not unreasonable 2-1, she wins. The early vote in North Carolina suggests a very close race.
Tilt Republican (n=1). Republicans should also be modest favorites to retain the Senate seat being vacated by Rob Portman in Ohio (R+9.8). And, in fact, Democratic House member Tim Ryan now trails Republican venture capitalist J.D. Vance 45.4% to 44.9% overall (n=36; B/B-), and 45.7% to 44.7% points in 21 polls conducted since Labor Day (B+/B). Four of the last 12 polls are tracking polls conducted by Republican-leaning Cygnal, meaning this election is likely closer to dead even. Plus, Vance still cannot climb above 45.7%, meaning Ryan only needs to win about five of every nine undecided voters to win.
Toss-up (n=1). In Nevada, Democratic Senator Catherine Cortez Masto has pulled slightly ahead of Republican former state Attorney General Adam Laxalt, 45.4% to 45.3% (n=33; B-/B), though she still trails 45.6% to 45.5% in 19 polls conducted since Labor Day (B-/B). With neither candidate ever topping 46%, and with 10% of the electorate up for grabs, this truly is a toss-up, though one in which incumbency and a history of Democratic candidates outperforming polling in Nevada give Cortez Masto the tiniest edge.
Tilt Democratic (n=0).
Lean Democratic (n=1). Sixteen polls (B/B+) have been conducted since October 3, 2022, the day the Daily Beast reported ardently pro-life Republican former National Football League star Herschel Walker had reimbursed his then-girlfriend for an abortion in 2009 and Walker’s son Christian tweeted about his father’s history of abusive and violent behavior. In these polls, Warnock leads Walker 46.5% to 46.2%, with an average 3.4 points for other candidates. In eight polls (B/B+) conducted just prior to the revelations, Warnock led 46.9% to 45.6%, suggesting Warnock lost 0.4 points while Walker gained 0.6; note, however, the post-revelations polls have skewed one point more Republican than the pre-revelation (post-Labor-Day) polls. Overall (n=52, B/B+), Warnock leads 46.9% to 45.4%, identical to his lead in 26 polls (B+/B) conducted since Labor Day. Georgia is still a Republican-leaning state (R+6.5), though, so a runoff occasioned by neither candidate winning a majority on Election Day is a strong possibility. If the race goes to a December runoff, FiveThirtyEight.com projects Walker to win an average 70% of the time, higher than last week.
Likely Democratic (n=1). The Senate seat most likely to change partisan hands is that held by retiring Republican Pat Toomey in Pennsylvania. Democratic Lieutenant Governor John Fetterman leads Republican television celebrity Dr. Mehmet Oz overall 47.6% to 43.4% (n=41, B). However, Fetterman’s stroke (leading to a halting debate performance), and some consolidation of Republican voters by Oz have cut Fetterman’s lead in half. Indeed, Fetterman leads by “only” 3.0 points – 47.3% to 44.3% (n=23, B/B+) – since Labor Day. Still, using only post-Labor-Day polling, Fetterman still has a win probability of 80.5% (with a projected margin of 2.4 points) – and should be very encouraged by the early vote tallies.
Solid Democratic (n=1). Kelly remains very close this week to winning the Arizona (R+6.1) Senate race. He now tallies 48.3% to 42.6% for Republican venture capitalist Masters overall (n=34, B/B-), and 48.0% to 42.8% in 24 post-Labor Day polls (B). I expect Kelly to win by just over four points.
Safe Democratic (n=12): Incumbents Michael Bennet (CO), Richard Blumenthal (CT), Tammy Duckworth (IL), Maggie Hassan (NH), Patty Murray (WA), Alex Padilla (CA), Chuck Schumer (NY), Schatz, Chris Van Hollen (MD) and Ron Wyden (OR) are near-locks to win reelection. Murray was effectively reelected on August 2, when she won 52.3% of the vote in an all-candidate primary; all Democrats combined won just under 55% of the vote. Meanwhile, House member Peter Welch is all-but-certain to win the Vermont Senate seat being vacated by seven-term Democrat Pat Leahy.
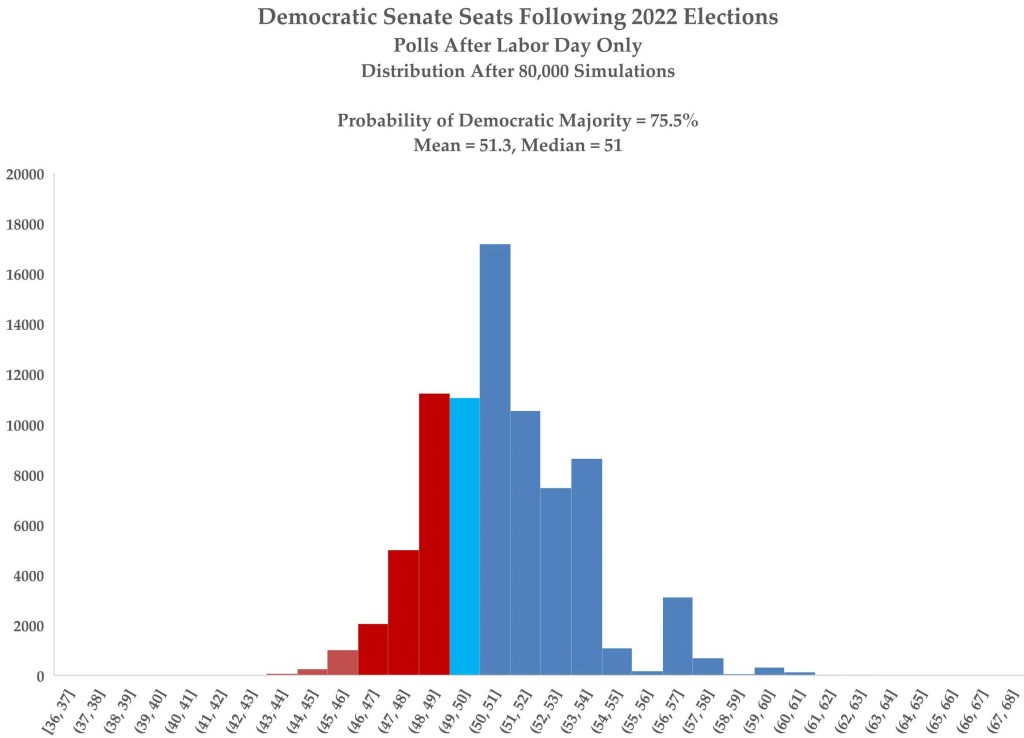
Bottom line: There is a 77.0% chance (75.5% using post-Labor-Day polls) Democrats hold at least 50 Senate seats – and thus maintain the majority. There is also a 63.4% chance Democrats net add Senate seats, with one being the most likely outcome (21.8%). There is also an 18.6% chance Democrats net lose one seat, giving Republicans a narrow 51-49 majority. Overall, there is a 52.7% chance Democrats land between a net loss of one and a net gain of two Senate seats, for an over/under of +0.5. While these values are lower than last week, much of that is due to methodological tweaks and Republican-leaning polling.
Figure 1: 2022 Senate election distribution

***********
Governors. As of October 30, 2022, 485 publicly-available gubernatorial election polls have been conducted since November 1, 2021. Only those in the open seat in Hawaii – which Democrat Josh Green is a near-lock to win – and in Alabama, Idaho and Wyoming – which Republicans Kay Ivey, Brad Little and Mark Gordon, respectively, are near-locks to win – do not yet have publicly-available polling. A net gain of three governor’s mansions by Democrats would give them 25, giving them parity for the first time since 2010. Table 3 shows updated values for all 36 gubernatorial elections in 2022.
Table 3: Democratic gubernatorial win probabilities and projected final margins, 2022
| State | Fundamentals | Polling (WAPA) | Poll Wt | Final Projection | |||
| Democratic seat | Margin | P(D win) | Margin | P(D win) | Margin | P(D win) | |
| Hawaii | 29.2 | 94.0% | n/a | n/a | n/a | n/a | 94.0% |
| California | 97.0% | 22.2 | 100.0% | -13.2 | 0.88 | 23.8 | 99.6% |
| New York | 86.0% | 8.6 | 100.0% | -11.7 | 0.89 | 9.9 | 98.5% |
| Rhode Island | 87.8% | 13.2 | 91.3% | -8.8 | 0.85 | 14.4 | 90.8% |
| Connecticut | 90.3% | 12.4 | 100.0% | -12.0 | 0.92 | 13.3 | 99.2% |
| Illinois | 89.7% | 12.8 | 100.0% | -11.1 | 0.84 | 14.5 | 98.4% |
| Oregon | 70.6% | -0.4 | 47.3% | -10.6 | 0.84 | 1.4 | 51.1% |
| New Mexico | 81.4% | 6.6 | 98.4% | -10.2 | 0.98 | 6.8 | 98.1% |
| Colorado | 80.5% | 14.1 | 100.0% | -2.1 | 0.88 | 14.4 | 97.6% |
| Maine | 78.7% | 9.9 | 100.0% | -5.1 | 0.81 | 10.9 | 95.9% |
| Minnesota | 74.4% | 6.3 | 98.8% | -6.1 | 0.94 | 6.6 | 97.4% |
| Nevada | 70.2% | -0.8 | 40.8% | -10.9 | 0.86 | 0.7 | 44.9% |
| Michigan | 69.9% | 6.3 | 100.0% | -3.6 | 0.88 | 6.7 | 96.4% |
| Pennsylvania | 45.2% | 9.8 | 100.0% | 11.9 | 0.89 | 8.4 | 93.8% |
| Wisconsin | 66.6% | 0.6 | 55.4% | -7.6 | 0.91 | 1.2 | 56.3% |
| Kansas | 28.1% | 2.8 | 63.0% | 13.5 | 0.78 | -0.3 | 55.2% |
| Estimated Democratic seats lost = 2.3 (range = 1.4 to 3.5)* | |||||||
| Republican seat | |||||||
| Vermont | 15.2 | 78.9% | -35.7 | 0.0% | 0.84 | -27.6 | 12.5% |
| Maryland | 26.4 | 92.0% | 29.2 | 100.0% | 0.88 | 28.9 | 99.1% |
| Massachusetts | 26.3 | 91.9% | 25.8 | 100.0% | 0.94 | 25.8 | 99.5% |
| New Hampshire | -12.5 | 25.0% | -16.6 | 0.0% | 0.89 | -16.1 | 2.7% |
| Florida | -19.2 | 15.1% | -8.6 | 0.0% | 0.84 | -10.2 | 2.4% |
| Arizona | -5.9 | 37.3% | -0.6 | 42.4% | 0.89 | -1.2 | 41.8% |
| Georgia | -13.2 | 23.9% | -6.0 | 0.0% | 0.91 | -6.7 | 2.2% |
| Iowa | -23.5 | 10.3% | -16.4 | 0.0% | 0.97 | -16.6 | 0.3% |
| Ohio | -23.5 | 10.3% | -18.4 | 0.0% | 0.91 | -18.9 | 0.9% |
| Texas | -25.7 | 8.4% | -7.2 | 0.0% | 0.87 | -9.6 | 1.1% |
| Alaska | -29.5 | 5.7% | -8.6 | 0.0% | 0.78 | -13.3 | 1.2% |
| South Carolina | -29.6 | 5.6% | -7.5 | 0.0% | 0.73 | -13.4 | 1.5% |
| Nebraska | -24.9 | 9.0% | -6.0 | 25.6% | 0.76 | -10.6 | 21.6% |
| Tennessee | -40.9 | 1.4% | -25.5 | 0.0% | 0.80 | -28.6 | 0.3% |
| Alabama | -42.9 | 1.1% | n/a | n/a | n/a | n/a | 1.1% |
| South Dakota | -43.3 | 1.0% | -13.9 | 0.0% | 0.87 | -17.6 | 0.1% |
| Arkansas | -30.1 | 5.3% | -19.4 | 0.0% | 0.82 | -21.3 | 0.9% |
| Idaho | -48.5 | 0.5% | n/a | n/a | n/a | n/a | 0.5% |
| Oklahoma | -51.5 | 0.3% | -3.8 | 22.0% | 0.78 | -14.3 | 17.2% |
| Wyoming | -61.2 | 0.1% | n/a | n/a | n/a | n/a | 0.1% |
| Estimated Republican seats lost = 3.1 (range = 2.6 to 3.7) | |||||||
| Overall expected Democratic seats gained/lost = +0.7 (range = -0.9 to +2.3) |
*Adding or subtracting 3 points to all WAPA, including generic ballot estimates
Gubernatorial incumbency advantages are 10.4 points for Democrats and 13.9 points for Republicans. On average, I now give 14% weight to fundamentals and 86% weight to WAPA, an increase of 1.0 points in polling weight since last week.
Safe/Solid Republican (n=16). Incumbents Mike DeWine (OH), Mike Dunleavy (AK), Gordon, Ivey, Bill Lee (TN), Little, Henry McMaster (SC), Kristi Noem (SD), Kim Reynolds (IA) and Chris Sununu (NH) are near-locks for reelection. University of Nebraska Board of Regents member Jim Pillen and former White House spokesperson Sarah Huckabee Sanders will be the next Republican governors of Nebraska and Arkansas, respectively.
Meanwhile, Democrats Stacey Abrams (GA), Charlie Crist (FL) and Beto O’Rourke (TX) trail incumbent Republican governors Brian Kemp, Ron DeSantis and Greg Abbott, respectively, by an average 7.3 points. Moreover, since Labor Day, all three incumbents top 50%, effectively ending these elections.
Likely Republican (n=2). Popular Republican governor Phil Scott will win reelection, despite Vermont’s D+28.9 status.
Meanwhile, four mediocre post-Labor-Day-polls (C+/B-) give Stitt “only” a 3.6-point lead over Oklahoma (R+37.8) Democratic state Superintendent of Public Instruction Joy Hofmeister, 44.9% to 41.3%, with fully 13.8% not choosing either. Exclude a Republican-leaning American Viewpoint poll which had many more undecideds at the expense of Hofmeister, and the lead vanishes: 44.1% to 43.8%. Stitt should still win by nearly 20 points – something similar played out in the polls in 2018, when he won by 12.1 points. Except – single polls out of Nebraska and South Dakota also show closer than expected elections. The safe bet is for Republicans easily to win all three elections, but more data is clearly warranted.
Lean Republican (n=0).
Tilt Republican (n=1). The open governor’s race in Arizona (R+6.1) has been trending Republican in recent polling, albeit strongly Republican-leaning. Democratic state Attorney General Katie Hobbs now trails television personality Kari Lake 46.3% to 46.9% overall (n=30; B/B+), and by 46.1% to 47.3% in 21 post-Labor-Day polls (n=21). Still, Lake has yet to crack 47.5% and the early vote is somewhat encouraging for Democrats.
Toss-ups (n=2). Three governors who first won in the 2018 Democratic wave find themselves facing a tough reelection fight: Laura Kelly in Kansas, Steve Sisolak in Nevada and Tony Evers in Wisconsin. In Nevada, Sisolak now trails Clark County Sheriff Joe Lombardo 45.5% to 44.7% overall (n=30, B/B-), and 45.8% to 44.6% in 15 polls (B/B+) conducted since Labor Day. And while I project him to win by 0.7 points based on incumbency, his inability to crack 45% should make Democrats a bit nervous.
The open governor’s race in strongly-Democratic Oregon (D+10.3) is a toss-up right now because of Independent Betsy Johnson, a former Democratic state senator. Overall (n=14; B-/B), Republican former State House Majority Leader Christine Drazan edging Democratic former State House Speaker Tina Kotek 37.8% to 37.4%, with Johnson at 15.5%. In 10 polls conducted since Labor Day (B-/B), Drazan’s lead is a bit wider: 38.7% to 38.0%, with 14.6% for Johnson. As of now, Johnson voters appear to breaking evenly between Drazan and Kotek, whom I still project to win by 1.4 points.
Tilt Democratic (n=2). The good news for Kelly in heavily Republican Kansas (R+21.3) is that in two polls conducted at least in part after Labor Day, she leads Schmidt 46.9% to 42.6%, putting her much closer to victory; overall, in four polls, she leads 46.6% to 43.4%. I project her to eke out a narrow victory, one closer to three points than 0.6 points.
The story is similar in Wisconsin, where Evers’ lead over businessman Tim Michels has dropped to 47.4% to 46.8% overall (n=16, B+), and to just 47.2% to 47.0% since Labor Day (n=11, B+/A-). I still expect Evers to win by just over one point, but a narrow loss is also quite possible.
Lean Democratic (n=0).
Likely Democratic (n=0).
Solid/Safe Democratic (n=14). The two governor’s mansions Democrats are near-locks to flip are in Maryland and Massachusetts, with both former Army Captain Wes Moore and state Attorney General Maura Healey projected to win by between 25 and 30%. Two other Democratic statewide officials are heavy favorites to win governor’s mansions held by retiring Democrats: Lieutenant Governor Green in Hawaii and Attorney General Josh Shapiro in Pennsylvania.
That leaves nine incumbent Democrats who are at least 9-1 favorites to win reelection: Hochul, Ned Lamont (CT), Michelle Lujan Grisham (NM), Dan McKee (RI), Janet Mills (ME), Gavin Newsom (CA), Jared Polis (CO), J.B. Pritzker (IL), Tim Walz (MN) and Gretchen Whitmer (MI). Yes, the polling has tightened in the Michigan and New York governor’s races, but both Whitmer and Hochul top 49.4% in post-Labor-Day polling, meaning only the margin of victory (high single digits) is truly in doubt.
Bottom line: Democrats remain the barest favorites to net at least one governor’s mansion (53.6% – 53.9% using post-Labor-Day polling), most likely (41.4%) between one and three. However, there is also a 32.5% chance Democrats net lose governor’s mansions, jumping to 34.5% using post-Labor-Day polling, with a loss of two being the likeliest outcome overall (19.9%). There is an 82.6% chance Democrats land somewhere between a net loss of two and a net gain of three governor’s mansions, for an over/under of +0.5.
Figure 2: 2022 gubernatorial election distribution


***********
While Democrats find themselves in a decent position – at least modest favorites to net Senate seats and governor’s mansions, while limiting losses in the House to 10 or 11 seats – it would only take a polling miss of 3 points in Republicans’ favor to flip the script. In this scenario, Democrats very likely lose the Senate, probably winning Pennsylvania (69.5%) while likely losing in Georgia (30.3%) and Nevada (26.8%). Democrats would still win back governor’s mansions in Maryland and Massachusetts, while likely losing in Kansas (43.1%), Nevada (21.2%), Oregon (32.6%) and Wisconsin (30.3%). And the likelihood of retaining House control would drop to 7.0%, centered around a loss of 19-20 seats.
However, it is equally plausible Democrats overperform polls by three points. In this scenario, Democrats would be slightly favored (59.4%) to retain House control, centered around a loss of one or two seats. Not only would Democrats flip Pennsylvania while holding all their Senate seats (with Nevada closest at 80.6%), they would also likely add North Carolina (60.8%), Ohio (73.0%) and Wisconsin (61.7%) for a gain of four seats – with Indiana (40.6%) now possibly in play. They would still top out at netting three governor’s mansions, with Arizona at 72.4%, though with Nebraska (31.0%) and Oklahoma (34.0%) possibly in play.
As of Halloween, though, I still prefer to drive straight down the middle, while awaiting new polling, especially on the generic ballot, to see if there are signs how undecided voters are breaking.
If you have read to this point, a) thank you very much and b) you are clearly a close student of American politics, meaning there are two folks I urge you to follow on Twitter. One is David Wasserman of the Cook Political Report (@redistrict), and the other is Professor McDonald (@ElectProject).
Until next time, if you are not already registered to vote, I urge you to do so immediately. And if you like what you read on this website, please consider making a donation. Thank you.
[1] This is according the methodologically conservative Deluxe model. The Classic and Lite models give Democrats Senate control probabilities of 60% and 62%, respectively.
[2] North Carolina had no Senate or gubernatorial elections in 2018.


2 thoughts on “2022 Elections Update: This Halloween, Democrats Have Little to Fear”