The 2021 elections end on November 2. New Jersey and Virginia are electing governors, while Boston and New York City will elect new mayors. Michelle Wu appears to be well-ahead of Annissa Essaibi George in a race between two Boston Democrats, while Democrat Eric Adams is a near-lock to be elected New York City’s second black mayor. Meanwhile, while Democrats are favored to win both gubernatorial elections, one election is far closer than the other – though Democrats could have reason to be concerned by the margins of victory in each race.
**********
I analyze state-wide elections using two primary indicators: fundamentals and polling averages.
By fundamentals, I mean the expected Election Day between a generic Democrat and a generic Republican based upon the state’s partisan lean, whether either candidate is an incumbent and the national partisan environment. My measure of state partisan lean is 3W-RDM, which I recently updated; New Jersey and Virginia are 12.0 and 3.9 percentage points (“points”), respectively, more Democratic than the nation as a whole. In New Jersey, Democratic governor Phil Murphy seeks reelection against former state General Assembly Member Jack Ciattarelli, and in Virginia Democrat Terry McAuliffe, who served as governor from 2014 to 2018, is running for his old job against businessman Glenn Youngkin. I estimate Democratic gubernatorial candidates have an incumbency advantage of 10.4 points. Finally, Democrats are currently ahead 2.6 points on the generic ballot: some variation of “If the 2022 election for U.S. House in your district were held today, would you vote for the Democrat, the Republican, another party or not at all?”
I calculate current margin using WAPA (weighted-adjusted polling average): an average of the 84 generic ballot polls released publicly since January 1, 2021 adjusted for time (days between January 1, 2021 and November 3, 2022), historic arithmetic bias (a tendency to over- or under-estimate Democratic margins[1]) and pollster quality. Data for the latter two adjustments drawn from here. I actually use the average of two WAPA: one treating all poll – even those from the same pollster – as statistically independent, and one that collapses polls from a given pollster into one value. These two values rarely differ by more than 0.5 points. However, because YouGov’s 26 weekly generic ballot tracking polls have a time-and-bias-adjusted average of 6.2 points, the former WAPA is D+3.2, and the latter is D+2.0. For comparison, using only the 10 most recent tracking polls – with median midpoint field date of October 3 – yields a WAPA of D+2.0.
Besides examining rolling polling averages over time, I now weigh polls released after Labor Day twice as much as earlier polls, and I calculate two projections of the final Election Day margin, based upon whether undecided voters split evenly or break 2-1 Republican. For the generic ballot margin, I assume third-party candidates earn a total of 1.5%,[2] leaving a sizable 13.0% of the electorate truly up for grabs. This many undecided voters means the final margin could be D+2.6 (even split) or R+1.7 (2-1 GOP).[3] Splitting the difference, a very reasonable scenario, suggests the “true” national partisan environment is very close to even, at D+0.5.
In other words, based solely on the fundamentals:
- Murphy should be cruising to reelection by between 20.7 and 25.0 points.
- McAuliffe is moderately favored by between 2.2 and 6.5 points.
So, how do these margins compare to the actual, publicly-available polling?
**********
Let’s start with New Jersey, where the only question is how large Murphy’s winning margin will be.

Only 10 polls of this election have been released publicly in 2021 – and just three since Labor Day. Overall, these B+-average polls have had a slight Democratic bias of 0.2-0.5 points, depending how I aggregate them. They show Murphy ahead 9.9 points, with about 13.0% choosing a third-party candidate or genuinely undecided. Depending on how they split (and assuming 1.5% third-party, cutting two 3% polling values in half), Murphy is “projected” to win by 6-10 points.
A key caveat is that the last publicly-released poll of this race was conducted between September 17 and 25; this WAPA is nearly one month old. Moreover, using a 5-poll rolling WAPA suggests Murphy’s advantage has dropped from 16.0 points in late May to 8-9 points since mid-August, mirroring a similar drop in the generic ballot from D+4.5 to D+2.5.[4]
As a result, I will project the final margin by weighting fundamentals 8%,[5] boosting this margin to 8-12 points. And while a 12-point victory is solid, it is still lower than the 14.3 points by which he won in 2017 and far below the 20-25 points the fundamentals suggest he should be ahead. I thus trim my sails a bit by halving the Democratic incumbency advantage and using the D+0.5 generic ballot margin, though I keep the current WAPA of 9.9. This equates to D+17.7 by the fundamentals…
…and a projected Election Day margin of 10.5 points – something on the order of Murphy 54.5%, Ciattarelli 44.0%, Other 1.5%.
**********
Which brings us to Virginia, which has Democrats more than a little nervous – leading the current president and vice president, former president Barack Obama and Stacey Abrams, among others, to campaign with McAuliffe.

However, the publicly-available polling belies the panic.
Overall, 28 polls released publicly in 2021 – 14 since Labor Day – have assessed this race. As in New Jersey, these B/B+ polls average a tiny Democratic bias of 0.3-0.5 points. They suggest McAuliffe has a small, but extremely stable lead of 2.5 points: 2.7 points treating all polls as statistically independent and 2.3 points calculating pollster-specific WAPA. Using only the 10 most recent polls, meanwhile the margin is 2.2 points; as Figure 1 shows, though, the margin has varied between 2.0 and 3.0 points since mid-August – a very narrow range that began too early to suspect pollster “herding.”
Figure 1: Virginia Governor’s Race Margin Since Mid-July 2021
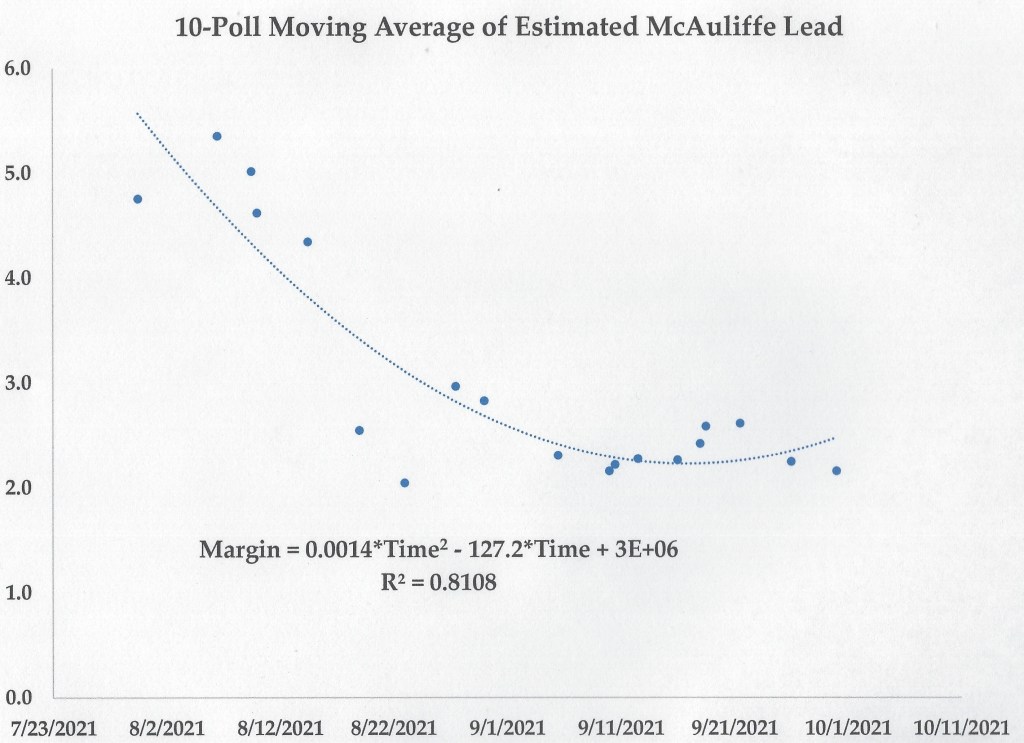
If anything, this polynomial regression model suggests McAuliffe’s position is improving slightly – and it implies a final Election Day margin of about 4.8 points. This model accounts for fully 81% of the variance in these data. Even using a linear regression model (r = 0.67), however, McAuliffe would still be ahead about 1.1 points on Election Day.
Turning to projections, I assume third-party candidates receive 1.0%, the amount Princess Blanding has earned in the last three polls listing her as an option. This leaves only 6.6% of the electorate truly undecided. If these voters break even, McAuliffe wins by 2.5 points, but if they break 2-1 Republican – well, McAuliffe still ekes out a 0.4-point victory.[6]
The projections are much more straightforward here because no incumbent is running. Using a Democratic generic ballot lead of 0.5 points, McAuliffe is ahead 4.4 points via the fundamentals. Weighting this value 5.4%[7] yields…
…a projected Election Day margin of 2.6 points – something on the order of McAuliffe 50.8%, Ciattarelli 48.2%, Blanding et al. 1.0%.
Somewhat echoing New Jersey, however, this projected margin is on the low end of the fundamentals range (i.e., much closer to R+1.7 nationally than D+2.5) and more than six points lower than Ralph Northam’s unexpectedly-large victory in 2017.
**********
Overall, in fact, these projections – while all important and necessary wins for Democrats – suggest the overall national environment has shifted about five points more Republican since 2017; add in the fact Democrats won the House vote by 8.6 points in 2018, 6.1 points higher than current generic ballot margins, and the shift increases to 5.4 points. A silver lining, however, may be that Democrats won the House vote by 3.1 points in 2020, and the generic ballot has barely changed since then, despite national Democratic woes. Moreover, all three trends examined here show the same pattern: a significant decline for Democrats from the spring that bottomed out in mid-August – and remarkably stable since then. It is as though, for all their handwringing, Democrats have a solid floor of support – one that makes them, at worst, the bare majority party.
As for the wailing in Virginia, I have two thoughts. One, folks do not always differentiate between a polling average and individual polls. While the statistical margin of error (“MOE”) is around 3-4 points for most polls, MOE drop very quickly once you aggregate even just a few of them; rather than 500-1,000 persons, my WAPA includes 22,675 persons, which translates to a 0.2% MOE – and over 8,000 in the most recent 10 polls, for a 1.0% MOE. WAPA are much more precise – though still subject to variations in things like likely-voter screening and biased sampling – than any individual poll.
Two, and perhaps more important, it is just good politics to declare yourself in a very close race with a serious chance of losing. This motivates marginal voters to act to save the election, as they do not want to be blamed for an unexpected loss. This is precisely what California Governor Gavin Newsom did late in his recall election – trumpet the (low probability) possibility conservative radio host Larry Elder could replace him in Sacramento. Of course, this approach risks increasing attention across the board, boosting turnout among voters who might otherwise assume it is not worth the time to vote because their candidate is going to lose. Still, in a Democratic-leaning state like Virginia, there are far more potential McAuliffe voters to harvest than Youngkin voters.
We shall see in two weeks – both who actually wins and just how good my projections are.
Until next time…please wear a mask as necessary to protect yourself and others – and if you have not already done so, get vaccinated against COVID-19! And if you like what you read on this website, please consider making a donation. Thank you.
[1] For polls conducted by firms on behalf of a specific candidate, I use the average of their historic bias and either -3.5 (Democratic candidates) and 3.5 (Republican candidates).
[2] As they did in 2020.
[3] Yes, it could also be D+6.9 if undecideds break 2-1 Democratic, but this is an extremely unlikely scenario in the first midterm election of a Democratic president.
[4] Technically, Democrats were ahead 3-4 points in March, 5-6 points in May, and have since stabilized 2-3 points since mid-July.
[5] Starting with a 50-50 polling split on January 1, then increasing the polling weight 1/306 – the inverse of the number of days from January 1 to November 2 – each day.
[6] And, yes, if they split 2-1 Democratic, McAuliffe wins by 4.6 points.
[7] Using September 30, the median field midpoint of the 10 most recent polls. Using the most recent poll, with a field mid-point of October 12, drops the weight to 3.5%. There is almost no difference between the two weights vis-à-vis the projected Election Day margin.


2 thoughts on “How does it look for Democrats in New Jersey and Virginia with just two weeks to go?”