ELECTION 2024 DASHBOARD
As of November 5, 8:03 AM EST
Presidential election: Polls assessing Democratic Vice President Kamala D. Harris and former Republican President Donald J. Trump are divided into those which do (weight: “number polls/3”; n=87) and do not (weight: “number of polls”; n=288) include Robert F. Kennedy, Jr. When given the option, I use polls that also assess named third-party candidates (except Kennedy). Polls conducted during or after October 22 are given 5.0 weight; polls conducted entirely after October 1 are given 3.0 weight, with polls straddling that date given 2.5 weight; polls during and after Labor Day are similarly weighted 1.5 and 2.0.
Projected final vote of Harris+2.1 (Harris+1.4, last 10 polls only) is based upon the Democratic presidential nominee winning the popular vote by a weighted-average 3.6 percentage points from 2012 to 20; final polling weight of 87.1% due to a mediocre average polling rating of 2.0 (out of 3).
Here are the final national averages.
Candidate Overall Average Last 10 Polls OnlyCandidate Overall Average Last 10 Polls Only
Harris 48.3% 48.7%
Trump 46.4% 47.6%
Named Other 2.5% 2.3%
Undecided 2.9% 1.4%
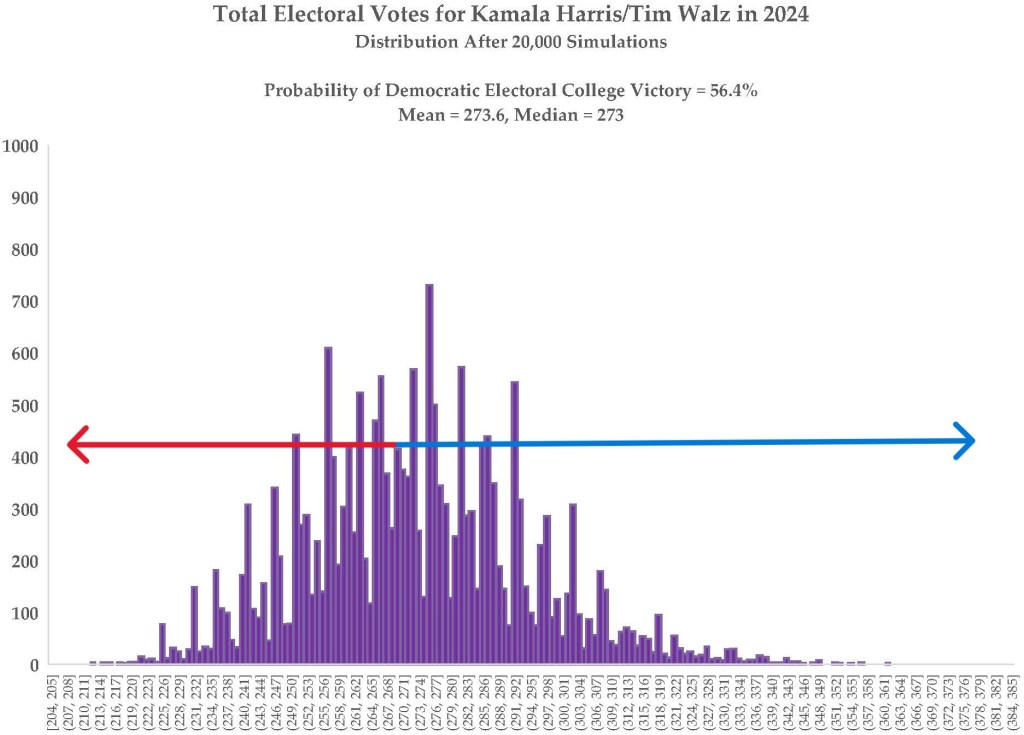
State-level polling (n=1,109; 44 states) and recent voting history, meanwhile, give Harris a 56.4% chance to win the Electoral College, with a median outcome of 273 Electoral Votes (“EV”), 3 more than required; I assume Harris wins an EV from NE-2 and Trump wins an EV from ME-2.
In 82.9% of 20,000 election simulations, Harris wins between 247 and 303 EV.
In 97.3% of the simulations, she wins between 226 and 319 EV, implying only seven states (AZ, GA, MI, NV, NC, PA, WI) are truly in play, despite the inclusion of Kansas (1 poll) in the table below.
Using 2020 presidential vote totals, state-level polling suggests Harris will win nationally by 3.2 points, 1.3 points lower than Biden’s 2020 margin – and 1.2 to 2.7 points higher than projected.
State EV Polling Average Projection P (Harris win)
19+DC 226 >92%
Michigan 15 Harris+1.5 Harris+1.6 66.3%
Wisconsin 10 Harris+1.5 Harris+1.4 64.5%
Pennsylvania 19 Harris+0.6 Harris+0.7 56.2%
Harris>50% 270
Nevada 6 Trump+0.3 Harris+0.2 49.0%
Harris<40% 262
North Carolina 16 Trump+0.9 Trump+1.0 38.2%
Georgia 16 Trump+1.3 Trump+1.5 33.6%
Arizona 11 Trump+1.9 Trump+2.0 28.6%
Kansas 6 Trump+5.0 Trump+9.6 15.8%
23 213 <10%
A revealing way to assess this race is to compare Harris’ and Trump’s current 10-poll average (adjusted for time, pollster quality and partisan lean) to the final percentages for Democratic President Joseph R. Biden, Jr. and Trump in 2020:
State Mode Biden/Harris Delta Trump Delta Shift
National Actual 51.3% 46.8%
Poll Average 48.9% -2.4 47.8% +1.0 Trump+3.4
Wisconsin Actual 49.4% 48.8%
Poll Average 48.7% -0.8 48.5% -0.3 Trump+0.3
Michigan Actual 50.6% 47.8%
Poll Average 47.9% -2.7 48.0% +0.2 Trump+2.9
Pennsylvania Actual 49.9% 48.7%
Poll Average 48.0% -1.9 48.6% -0.1 Trump+1.8
Nevada Actual 50.1% 47.7%
Poll Average 47.4% -2.7 49.3% +1.6 Trump+4.3
North Carolina Actual 48.6% 49.9%
Poll Average 47.7% -0.9 49.0% -0.9 Harris+0
Arizona Actual 49.2% 48.9%
Poll Average 46.8% -2.4 50.8% +1.9 Trump+4.3
Georgia Actual 49.5% 49.2%
Poll Average 47.5% -2.0 48.6% –0.6 Trump+1.4
7-state Ave. -1.9 +0.2 Trump+2.1
Harris averages 1.9 points below Biden’s 2020 percentages in these eight states, while Trump averages 0.2 points above his 2020 percentages. Trump’s underperformance in Georgia and North Carolina should concern the Republican Party, while that of Harris in Arizona, Michigan and Nevada – close to the 3.4-point drop nationally – should concern the Democratic Party, though Jon Ralston concludes Harris will narrowly win Nevada.
Earlier this year, Trump struggled to match his final poll averages in the competitive phase of the Republican presidential primaries. If this holds, Trump has essentially hit his ceiling of support in these states. Harris, meanwhile, could overperform her polling averages by as much as 1.9 points. If we add 1 point to Harris’ average, while leaving Trump’s as is, Harris wins the Electoral College 270-268, albeit with Georgia and North Carolina within 0.3 points.
The presidential election Tilts Democratic.
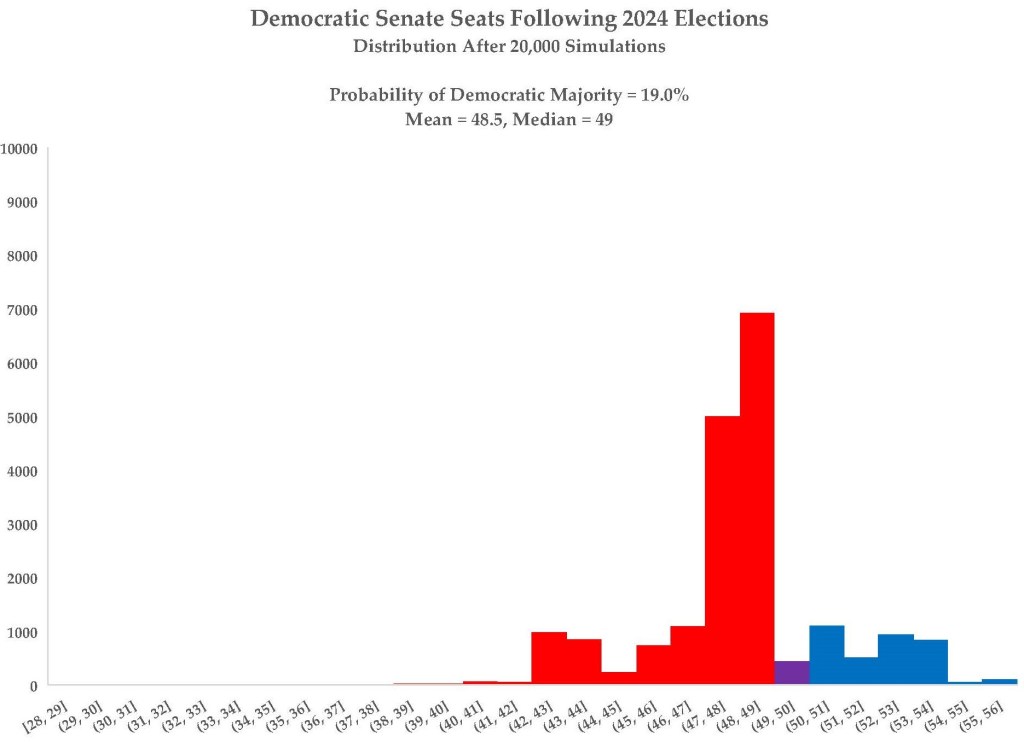
Senate: Republicans need to gain two Senate seats to have the majority – and only one if Trump is elected. They are currently 4-1 favorites to do so, with by far the likeliest outcome 51-49 Republican, making Senate control Likely Republican.
However, if Sherrod Brown is releected in Ohio AND a Democrat wins any of the elections in Florida, Mississippi (1 Democratic-aligned poll shows Republican incumbent Roger Wicker ahead just 47-42), Montana, Nebraska and Texas AND Harris wins the White House, Democrats would control the Senate, as Vice President Tim Walz would break the 50-50 tie.
State Current DEM GOP Average Projection P (Dem win)
15 states D >99%
Nevada D Rosen Brown D+5.9 D+6.0 94.1%
Arizona I (open) Gallego Lake D+5.5 D+5.0 89.9%
Michigan D (open) Slotkin Rogers D+4.1 D+4.5 88.8%
Penna. D Casey McCormick D+3.8 D+3.7 85.0%
Wisconsin D Baldwin Hovde D+3.1 D+3.1 79.8%
Dem > 75%
Seats=48
Ohio D Brown Moreno D+0.8 D+0.2 54.5%
Dem > 50%
Seats=49
Nebraska R Osborn (I) Fischer R+2.7 R+6.2 19.9%
Mississippi R Pinkins Wicker R+5.0 R+10.3 17.7%
Texas R Allred Cruz R+4.3 R+4.3 12.3%
Florida R Mucarsel-Powell R. Scott R+4.8 R+4.9 9.5%
Montana D Tester Sheehy R+7.3 R+7.1 4.8%
W. Virginia I (open) Elliott Justice R+33.5 R+33.4 0.0%
7 states R <2.0%
Governors: Of this year’s 11 gubernatorial elections, only three have been polled more than 10 times. One is Washington, where Democrat Jay Inslee is retiring after three terms. This election is Safe Democratic (99.9%), as Democratic Attorney General Bob Ferguson is projected to defeat former Republican House Member Dave Reichert by 13.3 points.
Another is North Carolina, where incumbent Democrat Roy Cooper is term-limited (n=86). This election is Solid Democratic (92.1%), with state Attorney General Josh Stein projected to defeat Lieutenant Governor Mark Robinson by 11.8 points.
Finally, the open gubernatorial election in New Hampshire (11 polls) is the most likely to result in a party switch, in this case from Republican to Democratic. Democratic former Manchester Mayor Angie Craig has a 47.3% chance to beat former Republican Senator Kelly Ayotte. Ayotte is currently projected to win by 0.04 points.
House of Representatives: Relative to 2022 results, Democrats need to net five seats to win a majority. Based upon 233 generic ballot polls released since January 1, 2024, I project Democrats win the national House vote by 0.8 points, suggesting Democrats will gain 4-11 seats.
The probability Democrats regain House control is 72.2%, or Leans Democratic.
Blog Posts Related to 2024 Election
November 5, 2024: Here are some final thoughts as polls open on the east coast.
As of 11 pm on November 4, more than 82.7 million votes have already been cast. This is 52.1% of all presidential votes cast in 2020. Recent polling suggests Harris is still winning just under 30% of the votes cast by registered Republicans and unaffiliateds.
While the early vote in Georgia – equivalent to 80% of the total 2020 presidential vote (as the early vote was in 2020) and as or a tick more Democratic (at least in terms of the in-person vote) – looks excellent for Harris, one thing in Pennsylvania nags at me.
In 2020, seven Democratic counties – the five southeastern counties (Bucks, Chester, Delaware, Montgomery, Philadelphia) plus Allegheny (Pittsburgh) and Lackawanna (Scranton) – accounted for 54.9% of all mail-in ballots, the only way to vote early in Pennsylvania; these counties accounted for 45.2% of the total vote cast that year. This year, they account for 49.2% of returned mail-in ballots, with the difference entirely due to Philadelphia. To be fair, 77.8% of such ballots have already been returned, only a bit less than the 81.8% statewide (85.2% in 2020). It is certainly possible these ballots simply take longer to process in Philadelphia, though Allegheny (85.1% returned) has more returne ballots overall (214,610 to 178,590). Perhaps most of the remaining 57,300 Philadelphia ballots will arrive today.
November 3, 2024: As I seem to be the Emerson College poll whisperer, here is a table showing how polling of the Harris-Trump election (excluding polls with RFK, Jr.) compares to the 29 other pollsters with at least 3 polls in 2024 (excluding SurveyUSA, who have not polled the presidential election since early August). Averages are adjusted for time and are prior to partisan adjustment. Green indicates poll with no FiveThirtyEight.com rating; I use the mathematical equivalent of a C for these polls. Red, blue and purple indicate polls I deem to be GOP-, Democratic- or bipartisan-oriented, respectively. Final averages are unweighted.

“Neutral,” highly-rated polls (>2.7) from Emerson College (-0.8), Siena College/New York Times (-1.6), Quinnipiac University (-1.8) and Beacon Research/Shaw & Associates (Fox News; -2.0), on average, show a Harris-Trump margin 1.6 points more Republican than average. By contrast, Ipsos (+1.6), Marist College (+1.4) and YouGov (+1.0) show a Harris-Trump margin 1.3 points more Democratic.
November 1, 2024: The probability Harris wins the Electoral College drops to 57.8%, its lowest point in weeks. There is a caveat, though. Nearly all of this decline is due to two sets of polls, conducted and October 25-29 and October 30-31, by AtlasIntel. These polls show Harris behind in the 7 battleground states by an average of ~2 points (47.6-47.3% to 49.3-49.7%). This Sao Paolo-based firm has a high pollster rating (2.7) and no obvious partisan lean, so they receive a high weight and no partisan deduction. However, they average 4.2 points more Republican in national polls assessing Harris and Trump (using the 28 pollsters with at least 3 polls).

October 26, 2024: I am more convinced than ever that early voters are not being sufficiently captured by pollsters, for both benign and nefarious reasons. Consider the 10-poll rolling average (adjusted for time, partisanship, pollster rating) of the generic ballot:
In polls centered on October 7 (using the middle field date), Democrats led Republicans by 1.5 points, exactly the weighted average of the Democratic margin in the House vote nationally over the last 3 presidential elections. Two weeks later, in polls centered on October 21, Republicans are now ahead -0.3 points, and the trend is clearly in their direction.
Now, some of this could be Republican voters coming home – except that the percentage other/undecided did not change. Instead, Democrats dropped from 47.3% to 46.4%, while Republicans jumped from 45.8% to 46.7% – the share of the two-party voted shifted nearly two points Republican.
What happened in early October to account for this shift?
If this were a pro-GOP bounce from the Vice-Presidential debate, it would have faded by now. Instead, the shift is noticeable at every level (House, Senate, president).
No other single event occurred in early October that could have pushed voters so strongly toward the Republicans – with one exception: the start of early voting, which Democrats are winning by at least 20 points.
If Democratic-leaning early voters are substantially underrepresented in current polling, that could easily account for polling shifts toward Republicans. In fact, much the same thing happened in 2022 – there was a noticeable shift in the polls toward Republicans as early voting continued, as I noted two years ago this week.
A week from Tuesday – please vote, if you have not already!
October 25, 2024: OK, what is going on with Nevada’s early vote?
In 2020, just over 1.4 million people voted for president.
But…1.98 million ballots have already been requested?
I think Professor McDonald has a mistake on his superb early voting website. I think he added 1 million to the number of Clark County ballot requests (listed as 1.4 million, though only 972,000 voted there in 2020). This would make the ballot request total 975,090, of which 232,156 have been returned, or 23.8%.
October 24, 2024: Something fishy is happening with recent polling.
While Republican percentages are stable, Democratic percentages are dropping – shifting to “Undecided/Other.” When some polls shift from registered to “likely” voters, every undecided voter is now a Republican voter.
Why does this make no sense, beyond the fact that for most of this campaign, there has been at best a 1-point margin shift going from registered to likely voters?
For one thing, undecided voters this late in a campaign tend to split somewhere between 2-1 and 50-50 between the two major-party candidates.
More salient, though, is that the early vote – 31.4 million, or roughly 20% of all votes cast in 2020 (158.6 million) – is breaking nearly 2-1 Democratic (assuming Harris is truly ahead 63-34 among early voters). You cannot get more “likely” than “already voted.” At the time of the poll, the registration split in early voting (in the 24 states reporting this information) was Democrats 46%, Republicans 32%, Other 22%. This means at least 17% of the 54% (31%) who are not registered Democrats voted for Harris. If 2/3 of registered Other voted for Harris, then 25% of registered Republicans also did. In our hyper-partisan era, this is an astonishingly-high percentage.
My suspicion – though I cannot prove it – is that early voters are being screened out of (some, but not all) polls, either because early voters don’t see the point in responding to the poll or because bad-faith pollsters are excluding them. Either way, the result is that reported margins appear more Republican than they are.
I also think traditional analysts are struggling to incorporate the current (very high, very Democratic) level of early voting, which began as a safety reponse to the COVID-19 pandemic in 2020, into their forecasts and projections; they fall back on “well, Trump was not on the ballot in 2022, and 2020 was a COVID year, so let us not read too much (meaning: “anything”) into early voting. (This is not a prediction, but my read of the early vote – especially the gender split of 55 female, 45 male – is that Harris could easily have a 13 million vote lead nationwide on Election Day. If Trump’s turnout operation is as bad as being reported, this election may effectively already be over.
In fact, I see an epistemic split between the world presented by the media – whose bias toward conflict and drama results in stories leading one to believe the election is extremely close, or Trump is slightly ahead – and the “real” one in which Democrats are racking up huge early vote margins, Haley Republicans are supporting Harris and the GOP has no ground game to make up this lead on Election Day.
Choose your adventure.
Twelve days.
October 21, 2024: I remain vexed by junk-GOP polls.
Since August 6, when Harris became the de facto Democratic presidential nominee, non-partisan pollsters with track records (i.e., has a FiveThirtyEight pollster rating) have conduted 162 polls assessing the presidential election (excluding Kennedy) in the seven battleground states. Nearly as many – 154 – were conducted by a pollster with a Republican-orientation, often for a conservative-leaning outlet. Using the 0-3 rating scale, the neutral polls are of much higher quality (average=2.5) than the junk-GOP polls (1.7). (This analysis excludes a few dozen Democratic-oriented and joint-partisan polls, and seemingly-neutral polls with no pollster rating.)
On average, Harris continues to fare an average of 0.7 points better in the good-faith polls. This is while Harris fares roughly one point worse in these polls in Arizona and Georgia; exclude three Quinnipiac University polls (average margin Trump+5.7) from Georgia, and the difference vanishes. Excluding these two states, the average difference is 1.4 points. Harris fares roughly two points better in the good-faith polls in Nevada and Pennsylvania.

Another difference between these two sets of polls is the percentage of respondents choosing neither Harris nor Trump. In the good-faith polls, only 3.9% choose either a third-party candidate or are undecided, while 5.1% do so in the junk-GOP polls. Thus, Harris’ overall average drops from 48.2% to 47.3%; Trump’s average changes little. In essence, the good-faith polls push about 1% of respondents from neither candidate to Harris.

Meanwhile, limiting the analysis only to the 10 most recent polls in each category – with the five most recent having twice the weight – makes the picture a bit murkier.

Harris is now losing in both sets of polls overall by around 0.5 points, though this masks the same divide as above. In the most recent good-faith polls, she trails by 2.5 points in Arizona and 3.2 points in Georgia (driven almost exclusively by a Quinnipiac poll deficit of 7 points; October 10-14); the deficit is between 1 and 2 points in the junk-GOP polls. By contrast, Harris fares about 1 point better in the good-faith polls in Michigan, Nevada, North Carolina and Pennsylvania, with the largest difference (1.6 points) in the latter. Harris and Trump are essentially tied in Wisconsin in both sets of polls.
The GOP-junk polls still have a higher share of third-party/undecided voters (4.4% vs. 3.4%), though now the differing one point splits evenly in the good-faith polls.
One conclusion to draw is that Republican-oriented pollsters are not concerned about Trump losing Arizona and Georgia – so their numbers there are more “honest – while they are very concerned about him losing the likeliest “tipping point” state, Pennsylvania. They are also somewhat concerned about Nevada and North Carolina. Both sets of polls have converged to near-ties in Michigan and Wisconsin, though Democrats are moving back ahead somewhat in the former.
Another conclusion is that I will not change how I adjust junk-GOP polls. Which means the final tweak to my “model” I expect to make is to give a weight of 5.0 to any poll whose field dates include or are entirely after Tuesday, October 22.
Finally, as much as I decry junk-GOP polls, there is some evidence Trump has gained roughly half a point in the polling, perhaps due to Republicans coming home to him. How this plays out when the ballots are counted, however, remains to be seen.
October 19, 2024: If you are experiencing deja vu this election season, you are not alone.
There are two reasons for this: this election bears an eerie resemblance to 2016 (but in reverse) and to 2022.
Earlier today, the FiveThirtyEight presidential forecast gave Trump a 52% chance to win the 2024 presidential election. This is the first time since August 7 that Trump has been the nominal favorite. G. Elliot Morris’ write-up of this shift is telling in its defensiveness. He does quite trust his own model; Nate Cohn of the New York Times has had similar moments of doubt.
There are other “Trump/GOP surging” narratives as well. Except that these do not comport with every other indicator of the relative electoral position of each candidate, nor with how the campaigns themselves are acting. The Harris campaign is campaigning with a group of former Republican officeholders who are urging what one could call “Nikki Haley Republicans” (those who voted for the former UN Ambassador in this year’s presidential primaries) to vote for Harris, and they are doing so in swing/GOP-leaning areas – all after Harris had a highly-rated interview on Fox News. The Trump campaign, by comparison, is engaged in before-the-fact legal battles – such as trying to stop the counting of overseas ballots – seeking to prevent Democrats from voting, or setting up challenges to a Harris win after the fact. Winning campaigns do not file more than 100 election-lawsuits weeks before voting ends – campaigns that are preparing to challenge an anticipated loss do.
The point being – at this time in 2016, Nate Silver (then director of FiveThirtyEight) was already proclaiming that Trump could win the Electoral College while losing the popular vote. Michael Moore echoed him, based on what he was hearing on the ground in his home state of Michigan. And yet, the vast majority of pundits – who, in retrospect, suffered a complete failure of imagination – confidently called Clinton the winner (2008 John McCain campaign chair Steve Schmidt said one October night on MSNBC – and here I paraphrase from memory – Clinton was going to be the 45th president of the United States, winning around 350 electoral votes).
Something similar is happening now. The polling showing Trump and other Republicans gaining does not comport with what is happening in the actual campaigns – nor does it take it account the Democrats’ large structual advantage in resources, early voting (especially in Georgia) and get-out-the-vote operations. It is though folks think Harris is going to win, yet are stuck with polls suggesting a tight race possibly tilting toward Trump – the reverse of the 2016 dynamic.
As for 2022, remember all the “red tsunami” talk? Remember how the FiveThirtyEight forecast suggested a Republican takeover of the Senate? Well, it was all hooey, as I wrote at this time two years ago.
Having examined hundreds of polls very carefully over the last eight years, I think I understand what happened in 2022 and what is happening now. For various structural reasons – mostly late-deciding voters breaking for Trump, according to exit polls – polling averages underestimated Trump’s margins in 2016 and 2020. Pollsters are determined not to repeat this “error” again in 2024, so they adjust their samples to reflect a more Republican electorate, usually through their “likely voter” screening or by not pushing undecided voters as hard to choose a candidate. Some pollsters are also “weighting on recalled vote,” a dubious practice at best.
For the high-quality, good-faith pollsters with a long track record like Emerson College, this has produced a slight Republican shift (1-2 points?) in their margins. But this obsession with 2016 and 2020 blinds them to the fundamental change in the electorate resulting from the June 2022 Dobbs decision overturning Roe v Wade. The 2022 elections and a string of special elections – nearly all featuring Democratic overperformance relative to baseline expectations – show the electorate became measurably more Democratic after Dobbs. Yes, Trump himself was not on the ballot in 2022 – but he was on the ballot earlier this year multiple times, and he consistently underperformed then.
This is only a small part of what see happening, though. The election of 2022 was also when I first began to notice a flood of lower-quality, bad-faith Republican-leaning polling – as I note in multiple posts below. As of early September, these polls averaged about 0.8 points more Republican than neutral polling in the same election. I have reason to believe (though I still need to do the math) that they have become even more Republican-leaning since then. For example, polls have shifted Republican in states like Arizona, Michigan and Wisconsin since then, without any external change in the campaign. If anything, the Harris campaign has gotten stronger (e.g., sitting down for a wide range of interviews) while the Trump campaign gets more erratic and dark. Yet voters are shifting from Democratic to Republican? Something does not add up.
My “model” treats the possible partisan polls lean differently than those of the more traditional prognosticators. Rather than rely on how these pollsters deviated from election results in previous elections – when we know that systematic bias in polls is random across elections – I assess how certain polls are faring relative to other pollsters in this election. And here I have some harsh words for FiveThirtyEight. Their otherwise reliable pollster ratings no longer include the partisan lean they use to generate their own forecasts. This is a shocking lack of transparency unjustified by, say, claims of proprietary methodology.
Actually, the only partisan adjustments I make are adding 0.375 to the Democrat’s percentage and subtracting 0.375 from the Republican’s percentage, while weighting polls either 0.75, 0.50 or 0.25 depending on how egregiously partisan the pollster is. And I am still likely giving too much credit to bad Republican polling – it is a vexing problem. Moreover, because I have no professional stake in a particular modeling scheme – and I am a great proponent of continually upating one’s priors – I can tweak my “model” with new information, which I then explain in a post. (I also do not use the national numbers at all in my model – there sheer volume polling from the key states renders them moot; they also suggest much wider victory nationally for Harris).
By contrast, folks like Morris and Silver (probably) over-adjust for past Democratic overestimation and (probably) under-adjust for current Democratic underestimation. This is why I consistently – and more in line with non-polling factors – show a Lean Democratic presidential election, while they are trapped in the “Toss-Up” zone.
It’s deja vu all over again.
October 12, 2024: I now weight polls conducted for specific candidates – by which I mean strategically-released internal campaign polls – 0.25. Given how few of these polls were in my Excel workbook, there was almost no impact on the projections. The exception is the Nebraska Senate race – seven of the 12 publicly-released polls are internal campaign polls (5 for Independent Dan Osborn, who is effectively the Democratic candidate in this election). Osborn now has a 39.3% chance to win, increasing the Democrats’ chances of retaining their Senate majority to 29.2%.
October 6, 2024: No new public polls were released on October 5, so I “stress-tested” my model again. Using only polls released entirely after Labor Day (weight = 1.5 if poll field dates straddle October 1, 2.0 if entirely after), the Harris-Walz ticket has a 69.9% chance to win the Electoral College, with a median 282 Electoral Votes. Nationally (61 polls plus 7 still listing Kennedy), Harris-Walz leads Trump-Vance 49.1%-46.0%, with 1.2% for named other, and 3.7% undecided. This translates to a projected winning Harris-Walz margin of 3.2 points, which is nearly identical to the 3.3-point margin derived from state-level data (235 polls from 34 states, topped by 31 in North Carolina and 30 in Pennsylvania). Among the battleground states, Nevada saw the largest jump in Democratic win probability (60.4% to 66.1%).
In the Senate, meanwhile, Democrats substantially increase their likelihood of retaining the majority from 24.6% to 45.3%; the median outcome is now 50-50. While Tester’s chance of winning in Montana drops to 14.0%, the Democratic candidate now has a 1-in-4 chance to defeat Republican incumbents in Florida (24.2%) and Texas (24.5%), while the Nebraska Senate race is a toss-up (54.3%, though with projected R+2.5).
Finally, Democrat Josh Stein now has an 88.2% chance to win the North Carolina governor’s race, by a projected margin of 10.9 points. The state’s recent Republican lean prevents Stein’s chances from being 100%.
The Democrats fare better across the board using only post-Labor-Day polls, relative to all 2024 polls, implying clear movement in their direction since the summer.
September 26, 2024: After long consideration, I decided to enlarge the margin of error around my state-level polling averages to account for systematic error more fully; I do not correlate this error across similar states, however, because that is accounted for by historic expectation (i.e., the partisan “gravitational pull” of a state). I now calculate random margin of error using the total number of respondents surveyed in a state since January 1. To this I add 3.0 which, when combined with the 7.0 margin of error around historic expectation, yields the 4-point average polling error since 2012. This brings the projected Electoral Vote distribution closer to Normal, as you can see. It also brings the seven “battleground states” closer to 50%, though still with a break between Nevada (56.4%) and North Carolina (43.0%) at 276 Electoral Votes, dropping the probability Harris wins the Electoral College closer to 2-1. It also greatly increases the likelihood – though still below 25% – Democrats retain the Senate.
One other smaller change: average pollster rating in a state is now the average pollster, not the average poll.
September 24, 2024: Four pollsters have conducted a total of seven national polls of the presidential election since Labor Day in which every respondent is forced to choose either Harris or Trump (or another named candidate, as in two HarrisX polls). Taking the average of the four within-pollster averages, Harris leads Trump 51.7% to 47.7%, with the remainder going to named third-party candidates. HarrisX has a strong Republican lean (as might ActiVote, but that is harder to discern), so Harris’ lead may be closer to 4.2 points in these polls, Harris, just shy of the 4.5 points by which Biden beat Trump in 2020.
Moreover, this is a wider lead than the overall September average of 3.0 points for Harris, suggesting undecided voters are likely to break for her.
September 22, 2024: After reviewing new polling from Democratic-aligned entities, I am no longer comfortable adding 1.5 points to the margins from these polls; I still give them only 0.5 or 0.75 weight, however. For why I had done this, please see the September 8 and September 9 entries below. There are relatively few such polls, so this does not markedly change probabilities and projections.
September 21, 2024: The “sleeper” election this cycle appears to be the regularly-scheduled Nebraska Senate election (not the special election which incumbent Republican Pete Ricketts is expected to win easily) between incumbent Republican Deb Fischer and Independent (and former Democrat) Dan Osborn, a labor leader and U.S. Navy veteran. While Osborn does not plan to caucus with either party, he is effectively the Democratic candidate.
Recent electoral history suggests Fischer should win by more than 20 points. However, she only has a 2.3-point lead, albeit in only six polls (none conducted after Labor Day), three conducted for Osborn or affiliated entities. That said, removing a dubious, Republican-leaning poll by Torchlight Strategies from July (and no longer adding 1.5 points to the Osborn polls – see September 14 entry), drops her lead to 1.3 points; averaging the two quality polls of the race puts Fischer ahead 1.5 points.
Most alarming for Fischer, though, is that barely cracks 41% of the vote, suggesting many habitually-Republican voters are slow to warm to her this year. My expectation that most of them will is why I currently give Osborn only a 4.3% chance of winning. His probability may well improve with higher-quality polling, however, so stay tuned.
September 18, 2024: If polls of the Montana Senate race are valid, then the likeliest outcome of this year’s Senate elections is 51 Republicans and 49 Democrats. If Harris is also elected president, though, it would only take one Republican defection for a 50-50 tie, which Walz would break. Moreover, if two Republicans simply became Independents, Democrats would control the 49-49-2 chamber.
In this scenario, Alaska Senator Lisa Murkowski – who effectively ran as the Democrat in 2022 against Trump-aligned Kelly Tshibaka, and who won as a write-in candidate in 2010 – and Maine Senator Susan Collins – who may run for a sixth term in blue-ish Maine (D+4.5) in 2026 – would wield extraordinary power, much as Democrats-turned-Independents Joe Manchin (WV) and Kyrsten Simema (AZ) did over the last four years.
September 15, 2024: As noted before, I “ground” my polling averages in what history suggests an election outcome would be. For presidential elections in a state, I use the weighted average of the three previous elections (1 for 2012, 3 for 2016, 5 for 2020). This, of course, gives 88.9% of the weight to elections in which Trump was the Republican presidential nominee.
Concerned I was thus “undercounting” the Trump vote, I re-ran today’s presidential election projections using the weighted average of the last two elections (1 for 2016, 2 for 2020), using the identical margin of error of ~7.0.
Curiously, while the “Blue Wall” states of Michigan, Nevada, Pennsylvania and Wisconsin shifted an average 0.9 percentage points (“points”) more Republican, the other three battleground states – Arizona, Georgia, North Carolina – as well as Texas drifted 1.1 points more Democratic, on average, mirroring a trend I first noticed here.
Overall, while the state-level win probabilities changed little, Harris’ win probability increased to 73.1%, with a median 281 Electoral Votes (mean=281.9). For now, though, I will stick with the 1-3-5 weighting scheme for “historic grounding.”
September 14, 2024: Here is a prime example of Republican-aligned entities “flooding the zone” in battleground-state presidential election polling.
Four polls assessing Harris and Trump in North Carolina were conducted after Labor Day and before their September 10 debate. Averaging (no weighting or adjustment) them shows Harris leading Trump 47.5% to 46.0%. These pollsters, including highly-rated Quinnipiac University and SurveyUSA, had an average pollster rating of 2.2 (out of 3.0), slightly higher than the overall state polling average of 2.0. Even Republican-aligned Redfield & Wilton Strategies gave Harris a 45%-44% lead.
Three polls conducted since the debate, however, show Harris trailing 46.2% to 48.5%. How is this possible when Harris was widely credited with winning the debate? Well, it is because the polls were conducted by Republican-aligned pollsters Quantus Polls and News, TIPP Insights, and Trafalgar Group, with a dismal mean rating of 1.3; Quantus Polls and News does not yet have a FiveThirtyEight rating, meaning I assigned it 1.4, roughly equivalent to a grade of C.
These bad-faith, highly-partisan pollsters are trying to frame the post-debate narrative (“Swing state undecided voters shifted to Trump!”) in a vitally-important state. Until a week or so ago, I would have added either 1.5 or 3 to the Democratic margin. Now, after examining all such polls in the seven battleground states in 2024, I add 0.75, which is why Harris’ North Carolina win probability has dropped from 51.6% to 46.4% in the last few days.
We shall see what the higher-quality, partisan-neutral reveals about the election in North Carolina and other battleground states over the next or so.
September 12, 2024: Some observations on how I “model” elections.
First, while I calculate, project and present intended vote percentages for Harris and Trump nationally on the “dashboard” above, I do NOT incorporate these values into my projections. It is the Electoral College (i.e., the states) that determines who wins the presidency, so these values tells us little, beyond knowing Democratic presidential nominees typically need to win by at least a few percentage points (“points”) nationally to guarantee a win in the Electoral College.
Instead, I only use state-level polls – there are more than enough in the dozen or so key states – adjusted by how the state has voted in the last three presidential elections. Projections based on these two data points applied to 2020 voter turnout suggest Harris is on track to win nationally by 3.1 points, a bit higher than the projections above and a bit lower than the 3.6-point weighted average of the last three presidential elections.
Second, unlike entities like FiveThirtyEight.com, I only address “random” polling error (i.e., traditional margins of error [“MOE”]) when I calculate win probabilities. MOE decreases in proportion to the square of the sample size and assume the only error in a polls is random error. Put another way, traditional MOE assumes the average of some value in many samples of the same population is the “true” value in that population. I calculate MOE using the total of the sample sizes of the (up to) 10 most recent polls, essentially treating these 10 polls as one poll with a ~10-times-larger sample size (decreasing MOE by the square root of 10, or roughly 3.3).
However, there is also “systematic” error, in which even an average of the highest-quality, highest-sample-size polls can deviate from the “true” value for many reasons, none of which can be “fixed” by increasing sample size. As a side note, this is why I do not adjust polls for sample size: precision does not equal accuracy. Systematic error results from subgroup samples that lean more or less Democratic than expected, partisan differences in who responds to a poll, inaccurate demographic weighting and/or “likely voter” screeners, unusually large late shifts in candidate choice by undecided voters or “leaners,” and so forth. Bad-faith, partisan pollsters may also put their thumb on the scale by asking a series of leading questions (Did you know that Candidate X is a Communist? Did you know that Candidate Y belongs to a white supremacist group?) before asking the horse race questions.
I do not yet account for “systematic” error for two reasons. First, I do not know exactly how much to increase the “sample-size” margin of error to account for it; increasing MOE pushes every state’s win probability closer to 50%, flattening the distribution of Electoral Vote totals shown above and bringing it closer to a pure Normal Distribution. One rule of thumb is to double the MOE – but does that mean doubling my 10-poll MOE, or multiplying it by the square root of 2 (~1.4)? Let us try doubling every state MOE. This lowers the median Electoral Vote total for Harris to 276 (mean = 276.5) and her win probability to 62.0%, still within the “Lean Democratic” range.
Another possibility is to add between 6 and 8 to each MOE reflecting the 3-to-4-point average polling miss in recent elections, sometimes in favor of Democrats and sometimes in favor of Republicans. This flattens the distribution even further, but now with a median Harris Electoral Vote total of 279 (mean = 280.3) and a win probability of 62.2%, also Lean Democratic. These are not especially large differences, and it is important not to get hung up on the specific win percentage as opposed to a categorization like “Lean” or “Likely.”
The other reason I do not account for systematic error (setting aside the fact it might go in different directions in sets of states, a level of over-complication I seek to avoid) is that I effectively do so by giving far more weight to recent electoral history (mean=28% in 31 states with at least one Harris-Trump poll) – which has a 6.9-point MOE – than other modelers. That is, my “model” expects voters in states like Michigan, Nevada, Pennsylvania and Wisconsin to drift toward narrow Democratic wins and voters in states like Arizona, Florida, Georgia and North Carolina to drift toward slightly-less narrow Republican wins. This is especially true before Labor Day, given how slowly older polls lose their impact on current averages.
In the end, thus, I am far more confident of Harris wins in Michigan, Pennsylvania, and Wisconsin, and far less confident of Harris wins in Arizona, Florida and Georgia, than other election modelers. Only Nevada and North Carolina are genuine toss-ups (well, the former “Tilts” Democratic for me) in every model. Until polling data clearly prove otherwise, in other words, my “model” defaults to a Democratic 276-262 Electoral College win.
September 9, 2024: Having examined partisan polls more carefully (see September 8 entry), I again rethought how I process them.
I now add 0.75 to the margin (Harris % minus Trump %) to all Republican-aligned polls and 1.5 to the margin for all Democratic-aligned polls. While the latter action seems counterintuitive, it is supported by the evidence. On balance, meanwhile, the average margin will decrease because there are five times as many Republican-aligned polls than Democratic-aligned polls. Polls conducted by partisan pollsters for partisan entities are now given 0.5 weight, while polls conducted by partisan pollsters on their own behalf – including joint Democratic-Republican polls – are now given 0.75 weight. Polls conducted for Fox News by Beacon Research/Shaw & Company Research are treated like partisan-neutral polls, as is the Emerson College poll conducted for RealClearPennsylvania.
September 8, 2024: Here are the weighted-adjusted averages for the 147 presidential election polls (Harris-Trump only) conducted entirely after July 21 – the day President Biden announced he would not seek reelection – in the seven battleground states, broken out by pollster partisanship.
Without any form of partisan adjustment, the Harris-Walz ticket leads by 0.5 percentage points (“points”) across these seven states, ranging from winning by more than 2 points in Michigan and Wisconsin, through winning by less than 1 point in Nevada and Pennsylvania, to losing by less than 1 point in Arizona, Georgia and North Carolina. When only the 68 partisan-neutral polls are examined, the lead increases to 0.9 points, with the leads and deficits both growing.
As expected, the 61 GOP-aligned polls are less favorable to Harris-Walz, though by a bit less than I anticipated: 0.7 points. This increases to 0.9 when Georgia – where Harris-Walz fare better in the GOP-aligned polls than in the partisan-neutral polls – is excluded.
Not expected, though, was that the nine Democratic-aligned polls would be about 1.5 points more Republican than the partisan-neutral polls; the nine polls that were jointly conducted by a Democratic- and a Republican-aligned pollster were not especially different. I suspect the Democratic-aligned pollsters are overcompensating for underestimating Trump’s margins in 2016 and 2020.
To be continued…
September 6, 2024 (2): Although they are not yet listed here, I am using the most recent YouGov polls of the seven battleground states, conducted for The Times of London, to make my projections. Adding them increased the Harris/Walz win probability from 61.5% to 63.0%.
September 6, 2024: Take the public polling of the Montana Senate election between incumbent Democrat Jon Tester and Republican businessman Tim Sheehy with many grains of salt. Of the 12 such polls released in 2024, eight were conducted by and/or on behalf of Republican-oriented entities. They show Tester down by an average of 3.1 points. Including a poll jointly conducted by Fabrizio Ward (Tony Fabrizio is Trump’s lead pollster) and the Democratic-oriented David Binder Research, the average increases to 3.7 points. By contrast, the three neutral polls (two from Emerson College, one from SurveyUSA) show Tester ahead 3.0 points; unfortunately, two of these polls were conducted in February, and the most recent Emerson College poll has Tester down 2 points.
Put another way, five polls of this election were conducted in August. Three have pollster ratings lower than B-, and they show Tester down 7 points. The two with at least a B+ rating, though, show Tester ahead by 1.5 points.
Overall, Tester is behind a weighted-adjusted 1.5 points, about double what it had been before I changed how I treated partisan polls. This translates to a projected loss of 2.5 points and a 13.1 chance of winning. I suspect, but cannot demonstrate, the election is much closer than this.
September 3, 2024: Making projecting elections harder this year is low-quality (based upon FiveThirtyEight.com’s ratings) pollsters flooding the zone with polls on behalf of GOP/conservative individuals or groups. Across the seven battleground states, 75 polls (45.7% of 164 polls) conducted of the Harris-Trump race since January 1, 2024 were conducted for GOP/conservative entities. By contrast, only 13 polls (7.9%) were conducted for Democratic/progressive entities. On average, the 75 GOP/conservative polls were released by a pollster with a 1.9 (out of 3.0) rating, compared to 2.2 for neutral pollsters; I assign a value of 1.4 to pollsters too new to have a FiveThirtyEight.com rating. (Yes, polling is mediocre overall.)
While partisan bias is usually clearly denoted here, digging through a website is occasionally required. The pollsters I deem GOP/conservative in these seven states are Insider Advantage (n=11), Trafalgar Group (8), Echelon Insights (7), Redfield & Wilton Strategies for The Telegraph (7), Public Opinion Strategies (5), SoCal Research (5), Spry Strategies (5), Fabrizio Ward/Fabrizio, Lee & Associates (4), The Bullfinch Group (3), Public Opinion Strategies (3), North Star Opinion Research (2), Quantus Polls and News (2), and 1 each from Cygnal, Landmark Communications, Noble Predictive Insights, RMG Research, TIPP Insights for Issues & Insights and Wick. Seven polls were conducted by Beacon Research/Shaw & Company Research (2.8) for Fox News, while one was conducted by Emerson College (2.9) for the right-leaning RealClearPennsylvania.
On average the GOP/conservative polls in these seven states showed an election 1.2 points more Republican than the neutral polls, ranging between 0.2 points more Democratic (Georgia) to 2.2 in Nevada. This suggests my average addition of 2.6 points to the Democratic margin is too high, and something closer to 1.5 is more accurate.
Meanwhile, removing every partisanship adjustment lowers Harris/Walz win likelihood to 44.8% – a Toss-Up – though they would still be favored in enough states (p>54%) to win 270 EV, with Nevada on a knife’s edge (projected R+0.1). Not distinguishing between lower-quality partisan polls and higher-quality neutral polls explains why so many perceive the presidential election to be a toss-up.
That said, I may have been OVER-adjusting the GOP/conservative polls. I thus now add either 1.5 (not 1.5 or 3.0) for GOP/conservative polls or -1.5 (not -1.5 or -3.0) for Democratic/progressive polls. This lowers Harris/Walz win likelihood to 63.9%, centered on 276 EV.
August 31, 2024: While I currently have the Democrats as mild favorites (right on the edge between Lean and Likely: 72.7%) to retain the White House, some stress-testing shows how tenuous this is.
A systematic polling error of 2 percentage points (“points”) in favor of Republicans – every state-level WAPA overestimates Democratic margin by 2.0 points (essentially my error in 2020) – drops win likelihood to 17.8%. Essentially, Harris/Walz would be favored to win every state through Michigan (56.2%) and Wisconsin (69.6%), while falling just short in Pennsylvania (34.2% – projected margin R+0.1). That 17.8% value is a bit deceiving, however, as Pennsylvania has voted with Michigan and Wisconsin in every presidential election since 1992.
A systematic polling error of 1 point in favor of Republicans drops win likelihood to 42.9%, though Harris/Walz would be favored in enough states (p>58%) to win 270 Electoral Votes (“EV”), with Nevada now on the edge (27.8% – projected margin R+0.1).
By contrast, a systematic polling error of 1 point in favor of Democrats increases win likelihood to 89.9%. Harris/Walz would be favored in enough states (p>60%) to win 303 EV – essentially replacing Georgia (32.3%, R+1.1) on the 2020 map with North Carolina.
And a systematic polling error of 2 points in favor of Democrats increases win likelihood to 96.0%. Harris/Walz would be favored in enough states (p>56%) to win 319 EV, though Georgia is essentially a toss-up (R+0.4). This is the 2020 map plus North Carolina.
Meanwhile, if I double the margin of error around every state-level WAPA (accounting for other forms of polling error), the Democratic win probability drops to 60.7%, right on the cusp between Toss-Up and Lean Democrat. The median Democratic EV total is 276, with Harris/Walz at least a 50.6% favorite in enough states to win that total, with North Carolina (45.5%; R+0.5) and Arizona (39.9%; R+0.9) just behind.
These results confirm my general sense that the Harris/Walz ticket is a modest favorite to win the 2024 presidential election as we head into the Labor Day weekend.


One thought on “2024 Election Analysis Archive”