In two previous posts (I, II), I described how my wife Nell, our two daughters and I were coping with social distancing and the closure of the public schools in Brookline, Massachusetts until at least April 3, 2020. Other than staying inside as much as possible, we converted our dining room into a functioning classroom complete with workbooks, flip charts and a very popular white board.
**********
On Friday, March 20, 2020, I came downstairs to find this in the “classroom.”

And this homage to the brilliant Netflix series Stranger Things by our 4th-grade daughter was on the always-popular white board; apparently she still retains the obsessive love of the show I instilled in her, and one I discussed last December.

While that same daughter had something of a rough morning, our 6th-grade daughter had a terrific morning; the latter girl is genuinely enjoying her workbooks and other projects. Providing ample time for each daughter to exercise and/or FaceTime friends helps immensely as well. That said, it was our younger daughter who, in the evening, asked if we could have “school” again tomorrow (Saturday). I am certainly happy to oblige—I have a review “quiz game” I have been thinking about putting together—but Nell and I suspect her outlook will be different in the morning. Still, to the extent these “classes” are about imposing structure and routine in the era of social distancing, maybe we should do some form of group learning activity every day, including weekends.
As I noted in the first “dispatch,” I planned to teach basic politics/government for an hour and basic applied math for an hour every weekday afternoon—except Friday. To break up the monotony, I will teach a hopefully-more-entertaining form of history on Fridays.
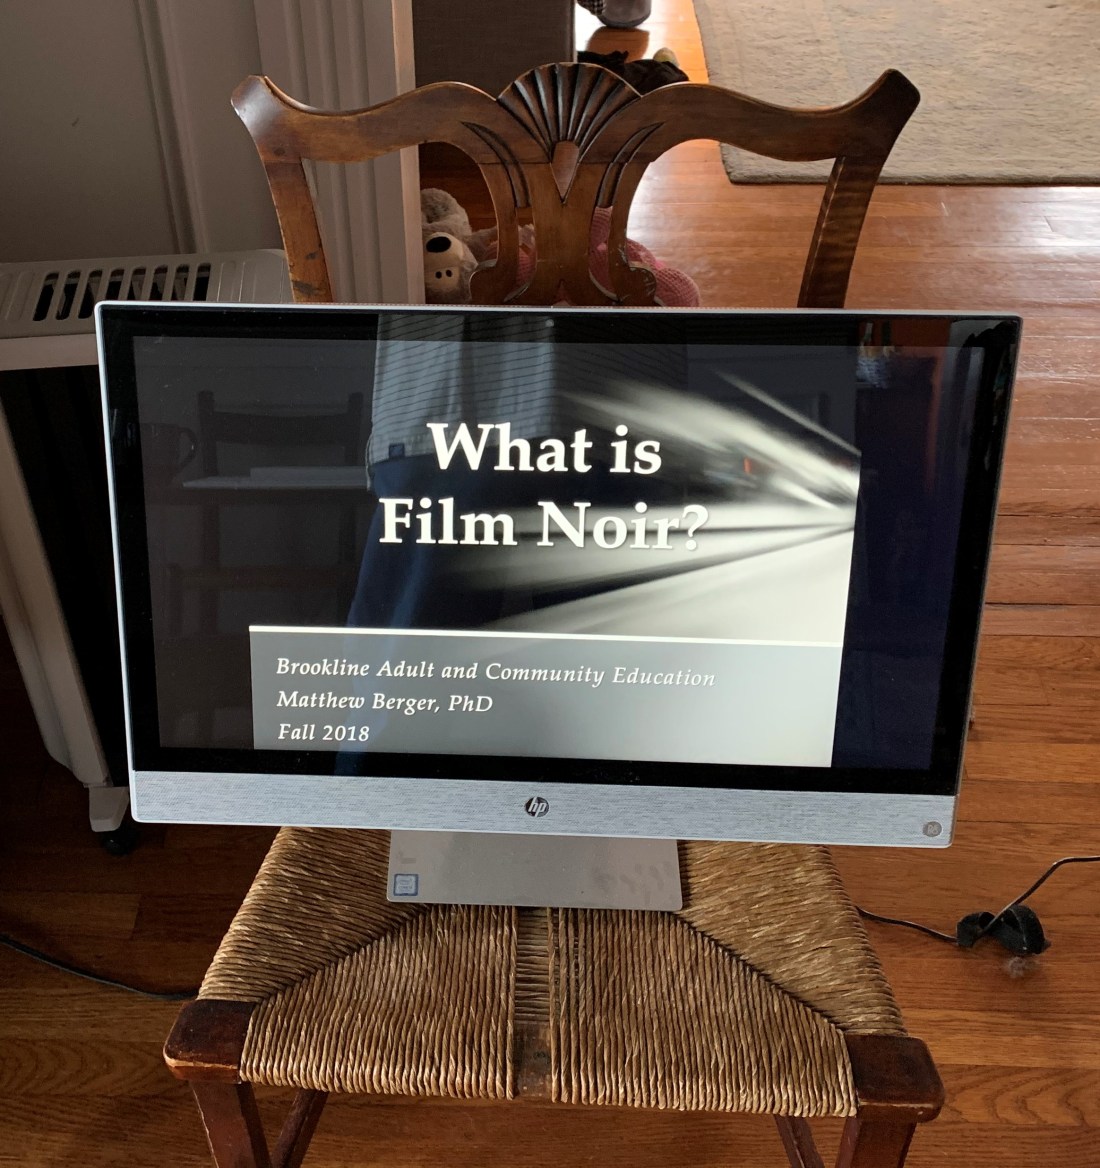
It is no secret I am a massive film noir fan. In October 2018, I had the opportunity to teach a course titled “What Is Film Noir” through Brookline Adult and Community Education. I only had six students, and I had a series of technical glitches trying to show movie clips—using my own DVDs—using Nell’s ancient laptop, but I nonetheless immensely enjoyed those four Wednesday nights.
Our daughters have actually watched a handful of classic films noir: both girls have seen The Maltese Falcon; Murder, My Sweet; Laura; The Naked City; Strangers on a Train and Rear Window; as well as long chunks of Out of the Past. Our older daughter has also seen Double Indemnity. They each spent some time at the first-ever NOIR CITY Boston in June 2018, watching the aforementioned Murder, My Sweet and helping their father sell Film Noir Foundation merchandise; this was my “reward” for having help to set up the festival. And they have certainly heard their father talk at great length about the subject.
It thus made perfect sense when it was time for “Daddy Prepatory” yesterday afternoon for me to set up my desktop computer in the “classroom” and open the PowerPoint slides from my first class. While I basically jumped ahead to slide 22 (of 130), in which I begin to tell the history of film noir as an idea, we did linger briefly on two photographs I had used to help to establish my bona fides to teach this class in 2018.
The first one I took in July 2017. It shows part of the “film noir” section at the now-defunct Island Video Rentals on Martha’s Vineyard.

The second photograph was of yours truly attending NOIR CITY 16 in San Francisco, California the following winter.

The two-part class went extremely well, with both girls asking insightful questions for the most part; our younger daughter did try to invoke Stranger Things once or twice, along with other more recent bits of pop culture. In the first hour, we focused on how “film noir” was a label first imposed after the fact on a particular set of American crime films, starting with two French film critics in 1946. After a 30-minute break, I told them two different, albeit broadly overlapping, “origin stories” for film noir:
- Traditional story: it was an inevitable organic artistic movement
- What in my opinion is a more accurate modification: it emerged from economic and creative necessity with the rise of B-movies in the 1930s
To be fair, by the middle of the second origin story, the usual doodling-based fidgeting had become sitting on the floor playing with our golden retriever, so I wrapped up quickly.
And with that we ended—possibly—classes for week one of our necessary experiment in home schooling.
**********
In my previous post, I briefly discussed some thoughts I had about the efficacy of using a designated test to determine whether a person has a condition such as the novel coronavirus. Specifically, I introduced the concepts of sensitivity (the percentage of persons who have the condition who test positive for it) and specificity (the percentage of persons who do not have the condition who test negative for it). And, given how hard it is to have 100% sensitivity and 100% specificity, I asserted epidemiologists generally prefer to have higher specificity (i.e., fewer false positives), which is achieved by loosening the criteria used to identify the condition. This preference stems from the relative rarity of most conditions epidemiologist study, which results in having many more false positives than false negatives.
Being the sort of person who does these sorts of things, though, I decided to use Microsoft Excel to test this idea. I set up a series of 2×2 tables such as the following in which I varied four values: sensitivity, specificity, prevalence (a proxy for whether everyone is tested, or only those persons deemed likeliest to have the condition) and the total number of tests performed.
|
Truth |
||||
| Positive | Negative | |||
| Observed | Positive | 142,500 | 42,500 | 185,000 |
| Negative | 7,500 | 807,500 | 815,000 | |
| 150,000 | 850,000 | 1,000,000 | ||
| Sensitivity | 95% | |||
| Specificity | 95% | |||
| Prevalence | 15% | |||
| # Tested | 1,000,000 | |||
| Ratio FN/FP | 5.7 | |||
What I was primarily interested in, beyond the raw number of false positives (FP) and negatives (FN), was the ratio of the former to the latter. Table 1 summarizes the results; the number of tests administered did not alter these ratios given the same set of sensitivity, specificity and prevalence values, so I omitted it from the table.
Table 1: Ratio of False Positives to False Negatives Using Different Combinations of Sensitivity, Specificity and Prevalence, Based on 1,000,000 Tests
| Prevalence | Sensitivity | Specificity | FP/FN | #FP | #FN |
| 15% | 95% | 95% | 5.7 | 42,500 | 7,500 |
| 90% | 95% | 2.8 | 42,500 | 15,000 | |
| 95% | 90% | 11.3 | 85,000 | 7,500 | |
| 80% | 95% | 1.4 | 42,500 | 30,000 | |
| 95% | 80% | 22.7 | 170,000 | 7,500 | |
| 33% | 95% | 95% | 2.0 | 33.350 | 16,650 |
| 90% | 95% | 1.0 | 33.350 | 33,300 | |
| 95% | 90% | 4.0 | 66,700 | 16,650 | |
| 80% | 95% | 1.5 | 33.350 | 66,600 | |
| 95% | 80% | 8.0 | 133,400 | 16,650 | |
| 50% | 95% | 95% | 1.0 | 25,000 | 25,000 |
| 90% | 95% | 0.5 | 25,000 | 50,000 | |
| 95% | 90% | 2.0 | 50,000 | 25,000 | |
| 80% | 95% | 0.25 | 25,000 | 100,000 | |
| 95% | 80% | 4.0 | 100.000 | 25,000 | |
| 85% | 95% | 95% | 0.18 | 7,500 | 42,500 |
| 90% | 95% | 0.09 | 15,000 | 42,500 | |
| 95% | 90% | 0.35 | 7,500 | 85,000 | |
| 80% | 95% | 0.04 | 30,000 | 42,500 | |
| 95% | 80% | 0.71 | 7,500 | 170,000 |
A test with sensitivity<80% and/or specificity<80% should not be utilized. Also, for any prevalence, the ratio of FP to FN will be the same across cases where sensitivity=specificity, albeit with different raw values.
Here are the primary conclusions from Table 1:
- The lower the prevalence—or, in the case of COVID-19, the less you restrict testing only to those deemed likeliest to have it—the higher the likelihood you will have many more false positives than false negatives, irrespective of sensitivity and specificity
- Within a given prevalence level, FP/FN is
- Lowest when specificity > sensitivity
- Highest when sensitivity > specificity
- In the “middle” when sensitivity = specificity
- The total number of “false” values (FP + FN) is
- Lowest when both sensitivity and specificity are equal and close to 100%
- Highest when sensitivity >> specificity
I saw a report on Twitter that 33% of persons testing positive were false positives. Based on these 20 scenarios, that would seem to indicate a situation where a fairly wide swath of the population is being tested (prevalence=15%), both sensitivity and specificity are at least 90%, and sensitivity > specificity. That percentage, which is not THAT meaningful, to be pehonest, would decrease if specificity were equal to or higher than sensitivity.
If you want to explore other scenarios like this, here is a protected copy of the workbook.
Until next time…please be safe and sensible out there…


3 thoughts on “Dispatches from Brookline: Home Schooling and Social Distancing III”