In my last essay, I took a (somewhat) wicked early look at the 34 United States Senate elections scheduled for 2024.
I now turn to the 435 elections for the United States House of Representatives (“House”) in 2024.
Specifically, I assess the probability Democrats gain the minimum five seats they need to regain the House majority. This number is based upon the 222-213 seat majority Republicans held after the 2022 elections, not the current House configuration of 220 Republicans, 213 Democrats and two vacancies.
Rather than examine each race, though, I take a 30,000-foot view.
***********
In 2017, I learned that the best predictor of how many House seats a party would net gain or lose in an election is the difference in that party’s margin of the total national House vote from that of the previous election.
For example, in 2022, Democratic House candidates combined to win 47.8% of the roughly 107.7 million votes cast in House elections. Republicans won 50.6% of those votes, with the rest going to non-major-party candidates. Thus, the Democratic margin in the national House vote in 2020 was 47.8% – 50.6% = -2.8 percentage points (“points”). In 2020, however, Democratic candidates topped Republican candidates 50.8% to 47.7%, for a margin of 3.1 points.
That is, the Democratic margin on the total national House vote dropped from 3.1% to -2.8% between 2020 and 2022, which is a change of -5.9 points. This helps to explain why the Democrats lost nine House seats in 2022, going from a post-2020-election majority of 222-213 to a post-2022 election minority of 213-222.
Now, in 2020, when the Democrats won a majority of the total national House vote, they still lost 13 seats relative to their post-2018-election majority. Why? Because in 2018, they won the total national House vote by 8.6 points (53.4%-44.8%), meaning their margin declined by 5.5 points in 2020 from 2018.
In other words, it is not the absolute margin by which a party wins the total national House vote that determines how many seats that party wins or loses in an election, it is the change in that margin from the previous election.
This makes sense, if you think about an electorate shifting from election to election – which is called a “swing” in parliamentary systems. If the electorate shifts 3.1 points more Republican from election to election, then, presumably, every House race Democrats won by less than 3.1 points become narrow Republican victories. It is not quite that clean, but that is the basic premise.
It is also empirically true, as Figure 1 shows.
Figure 1:
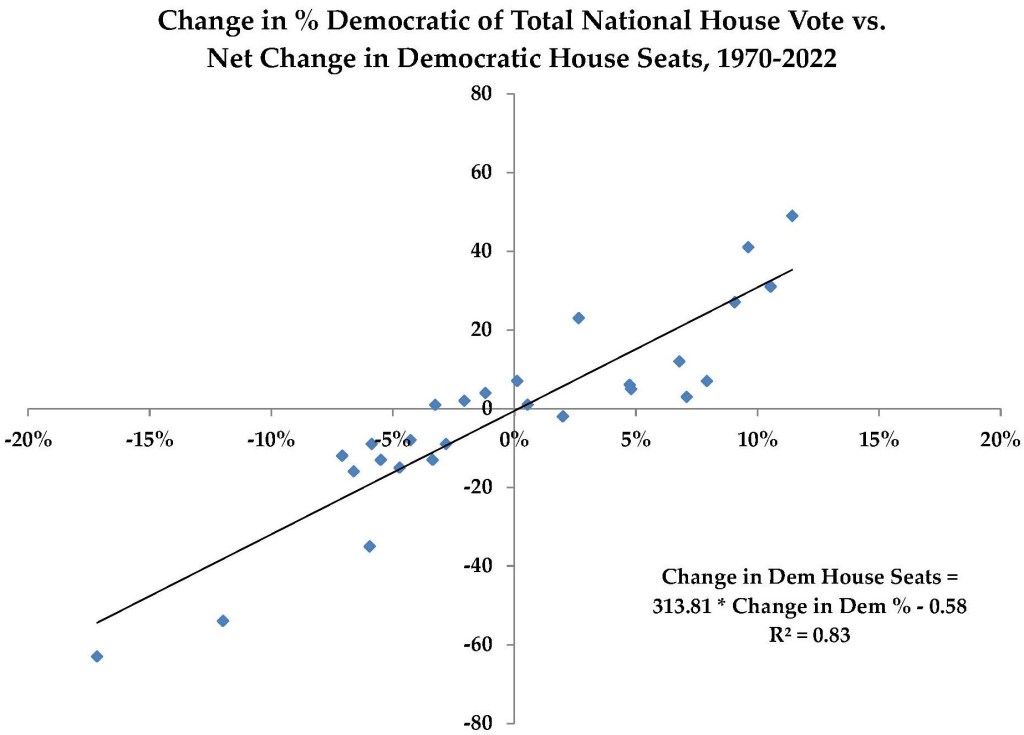
When I estimated the ordinary least squares (“OLS”) regression – think “y = mx + b” – I used decimals to represent percentages. Thus, 3.1% = 0.031.
The bottom line is this: Democrats gain an average of 2.6 (3.14 – 0.58) House seats from 2022 for every 1 point they increase their margin in the 2022 total national House vote from 2020. Thus, to win five seats, Democrats need to increase their margin in the total national House vote from 2022 by 1.8 points – or, to put it another way, finish no worse than about 1 point behind the Republicans in that vote in 2024.
As you can see from Figure 1, this is not a perfect fit (change in margin accounts for a sizable, but not complete, 83% of the total variance in change in House seats), so there is some “wobble” in this estimate.
There is also a bit of a catch.
I calculated this OLS regression using data from each even-year election pair going back to 1968-70 (n=27). This includes 13 presidential election years and 14 midterm election years. And it turns out the equation differs substantially when you only examine the 13 presidential election years, as you can see in Figure 2.
Figure 2:

What is most striking is how much less variation in seat change there is during presidential years. As a result, Democrats gain an average of 4.16 – 2.73 = 1.43 House seats for every 2 points they add to their 2022 margin the total national House vote. Under this model, Democrats would need to increase their margin by 3.8 points – meaning winning the total national House vote by 1.0 points in 2024 – to net at least five votes. Moreover, with only half the data points, there is far more “wobble” in this estimate.
Given this clear divide, I used both models to assess the likelihood Democrats net at least five House seats in 2024. I used the 95% confidence intervals derived from running the OLS regressions in Stata 9.2 to estimate this probability over a range of possible changes in Democratic House vote margin from 2022 to 2024, as shown in Figure 3.[1]
Figure 3: Probability Democrats recapture House in 2024 depends upon how much their national margin increases
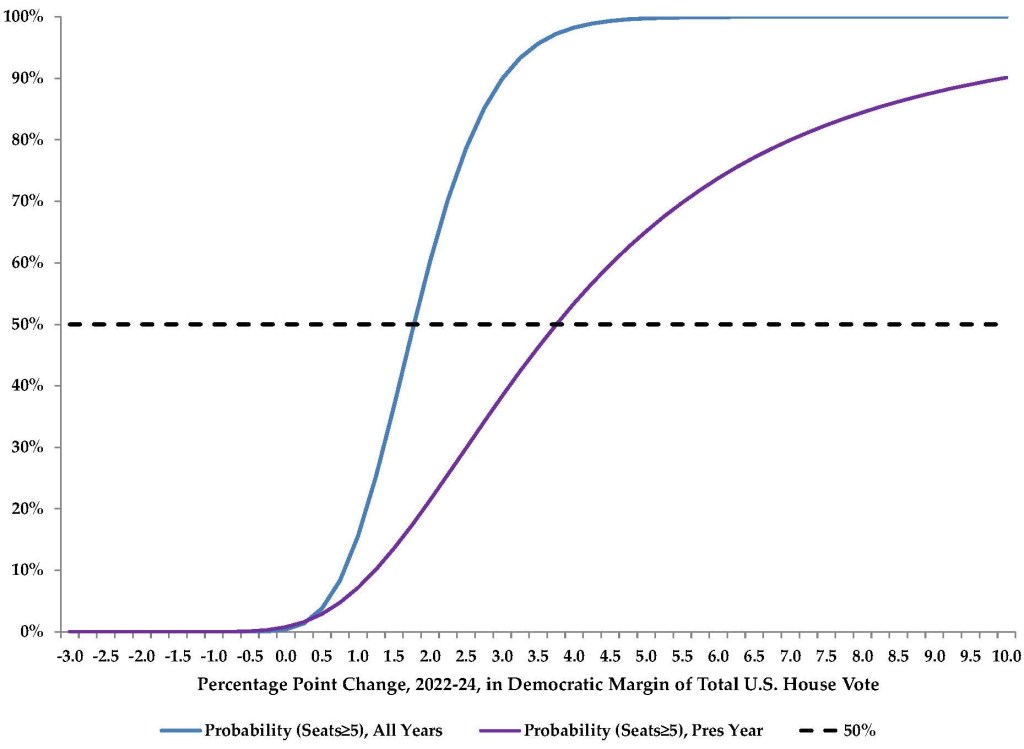
Clearly, the all-elections model is far more optimistic for Democrats, as they become 2-1 favorites to regain the majority with only a 2.2-point increase in margin (i.e., losing the total national House vote by 0.6 points). By contrast, using the presidential-elections model, Democrats need to increase their margin by about 5.2 points (i.e., winning the total national House vote by 2.4 points) to be 2-1 favorites.
In five of the last seven presidential elections, Democrats gained at least 2.0 points in their national total House vote margin, and in two of the last three presidential elections, they gained at least 4.7 points, so both outcomes are plausible. In fact, the last two times a Democratic president ran for reelection – 1996 and 2012 – the Democrats gained 7.1 and 7.9 points, respectively, in that margin; unfortunately, Democrats lost 6.0 points in their margin when Jimmy Carter sought reelection in 1980. Plugging a 1-3-5 weighted average of 6.1 points into the two models yields Democratic House recapture probabilities of 100% (all elections) and 74.5% (presidential elections).
So, it looks very good for Democrats in their quest to regain control of the House, right?
***********
Well, not so fast.
Using the seven generic ballot polls released entirely in January 2024, I estimate Republicans currently lead Democrats by about 2.1 points in the total national House vote. If this were the actual margin in November, Democrats would only gain 0.7 points from their 2022 margin, yielding House recapture probabilities of only 7.2% (all elections) and 4.4% (presidential elections). Using the FiveThirtyEight estimate of R+1.2%, increases these probabilities somewhat, to 41.5% (all elections) and 15.0% (presidential elections).
My approach to projecting November votes this early is to average current polling values with historic trends in some way. A weighted average of the last six House elections – weighting presidential years higher than midterm years[2] – implies Democrats win the total national House vote by 1.0% and suggests an “opening value” of losing the total national House vote by 0.6 points.[3] This increase of 2.2 points translates to Democratic House recapture probabilities of 68.4% (all elections) and 28.4% (presidential elections).
Splitting the difference suggests House control begins as a toss-up, though this feels like an underestimate given what happened the last three times a Democratic president sought reelection. Now, a margin increase of 6.1 points means Democrats win the total national vote in 2024 by 3.3 points. The average of 1.0 and 3.3 is 2.2, which – when applied to the generic ballot estimate – yields a projected Democratic margin of -0.2, which in turn yields Democratic House recapture probabilities of 81.5% (all elections) and 31.6% (presidential elections).
Putting these calculations together suggests Democrats begin the election year no worse than even money to recapture the House in 2024, and are probably at least modest favorites. As more generic ballot polls get released, meanwhile, I will update these probabilities.
Until next time…if you like what you read on this website, please consider making a donation. Thank you.
[1] I divided the 95% confidence interval generated by various values of change in margin (UL = 3.72x + 3.56, LL = 2.55x – 4.71 for All Elections model; UL = 3.39x + 3.55, LL = 0.73x – 9.00 for Presidential Elections model) by 3.92 (i.e., 1.96 * 2) to get the standard error for each iteration. I then estimated the probability of ≥5 from a normal distribution in which the mean is the estimated change in seats and the standard error is as calculated above.
[2] Weights: 2012 (4), 2014 (1), 2016 (5), 2018 (2), 2020 (6), 2022 (3)
[3] Technically, polling average is weighted 0.524, and historic trend is weighted 0.476.


maybe
LikeLike