UPDATED Midnight EST, November 20, 2018. As of this writing, Democrats have netted 38 seats in the United States House of Representatives, with three races still to be called. Democrat Ben McAdams narrowly leads incumbent Republican Mia Love in Utah’s 4th Congressional District (CD), while Democrats trail narrowly in California’s 21st and Georgia’s 7th CD. For a fuller analysis of the 2018 midterm elections, see here. For more details on called and uncalled races, see here and here.
**********
With Democrat Conor Lamb’s narrow victory over Republican Rick Saccone in the March 13, 2018 special election to fill the United States House of Representatives (House) seat vacated by Republican Tim Murphy, there were 238 Republican-held seats, 193 Democratic-held seats and four open seats (2 Democratic, 2 Republican).
The two Democratic open seats (MI-13, NY-25) are likely to remain open until the entire House is up for election on November 6, 2018. In the last three presidential elections, the Democratic nominee won these Congressional districts (CD) by an average 67.4 and 18.3 percentage points (points), respectively, so it is highly likely both seats will be won by Democrats. The seat vacated by Republican Trent Franks (AZ-08) will be filled in a special election on April 24, while that of Republican Patrick Tiberi (OH-12) will be filled in a special election on August 7. The last three Republican presidential nominees won these two CDs by 22.7 and 10.2 points, respectively. The Arizona seat will likely remain Republican, though the Ohio seat could be close.
For now, however, let us assume that party control of these four CDs does not change. That would leave the partisan balance at 195 Democrats and 240 Republicans. This means that Democrats need to flip a net total of at least 23 seats to win a House majority after the 2018 midterm elections.
In a previous post, I listed projected Democratic net House seat gains based upon four models; I developed two of these models.
Briefly, I use the change in the margin by which Democrats won/lost the total nationwide vote for all 435 House seats (Democratic % – Republican %) from the previous Congressional elections (24 election, 1970-2016). In 2016, the Democrats lost the national House vote 47.6% to 48.7%, for a margin of -1.1 points[1]. The current FiveThirtyEight estimate is that Democrats leading in generic Congressional polls (“If the election was held today, would you vote for the Democratic or Republican candidate in your district?”) by 6.5 points (13.1% unsure/other parties). If that were the actual election margin, that would equal a change of 6.5 – (-1.1) = 7.6 points.
In my “simple” ordinary least squares (OLS) regression model, I use only this value:
Estimated Democratic net seat gain = -1.63 + 3.11 * Change in Democratic margin
On average, every one percentage increase in the change in Democratic margin nets Democrats 3.1 additional House seats. Plugging a 7.6 point change in Democratic margin into the formula yields:
-1.63 + 3.11 * 7.6 = 22.01
This model has Democrats falling one seat shy of a House majority, even after winning the national House vote by 6.5 points—a result that should give believers in “one person, one vote” pause.
The 95% confidence interval (CI) around this estimate is 13.3 – 30.8, meaning we can say with 95% confidence that a 7.6 point shift in Democratic national House margin would result in a net gain of between 13 and 31 seats. This translates to a 41.2% chance the Democrats net at least 23 House seats in November 2018.
Again—that is when Democrats win the national House vote by 6.5 points. Take your pick of what to blame: incumbency advantage (Republicans gained a net 63 House seats in 2010 before the most recent round of redistricting), geographic self-sorting (Democrats in urban areas, Republicans in rural/small town areas, suburbs up for grabs) and partisan gerrymandering.
In a slightly more complex model, I account for whether the Congressional election coincided with a midterm or a presidential election:
If Midterm: Estimated Democratic net seat gain = -2.77 + 3.41 * Change in Democratic margin + 2.433
If Presidential: Estimated Democratic net seat gain = -2.77 + 2.08 * Change in Democratic margin
And here I make a confession.
In previous discussions of results from this complex model, I used an incorrect “intercept” term (-1.63 instead of -2.77), increasing estimated net Democratic House seat gains (by 1.14) and probabilities of House recapture.
Not a huge change, but I do strive for accuracy here.
Cutting to the chase, under the assumed 7.6 point change in national Democratic House margin, the complex model yields an estimated Democratic net gain of 25.6 seats (95% CI: -8.2 to 59.3[2]) with a 56.0% probability of regaining control of the House.
Here is Table 1 from my previous post updated to reflect the corrected “Berger 2” model and a required 23 net House seat gain for Democrats.
Table 1: Projections of 2018 Democratic net gains in House seats
| Dem national House margin | Abramson | Brennan | Berger 1 | Berger 2 |
| 2% | 19 | 5 | 8
(0%) |
10
(12%) |
| 4% | 23 | 7 | 14
(1%) |
17
(33%) |
| 6% | 27 | 13 | 20
(28%) |
24
(52%) |
| 8% | 30 | 15 | 27
(78%) |
31
(66%) |
| 10% | 34 | 21 | 33
(97%) |
37
(75%) |
| 11% | 36 | 28 | 36
(99%) |
41
(78%) |
| 12% | 38 | 31 | 39
(99+%) |
44
(81%) |
| 14% | 42 | 41 | 45
(99+%) |
51
(85%) |
| 16% | 46 | 56 | 52
(100%) |
58
(88%) |
And here is my updated graphic displaying the probability Democrats recapture the House given various changes in Democratic margin (and dotted line indicating House control is 50-50):
Figure 1: Probability Democrats control U. S. House of Representatives after 2018 elections given change in Democratic margin from 2016
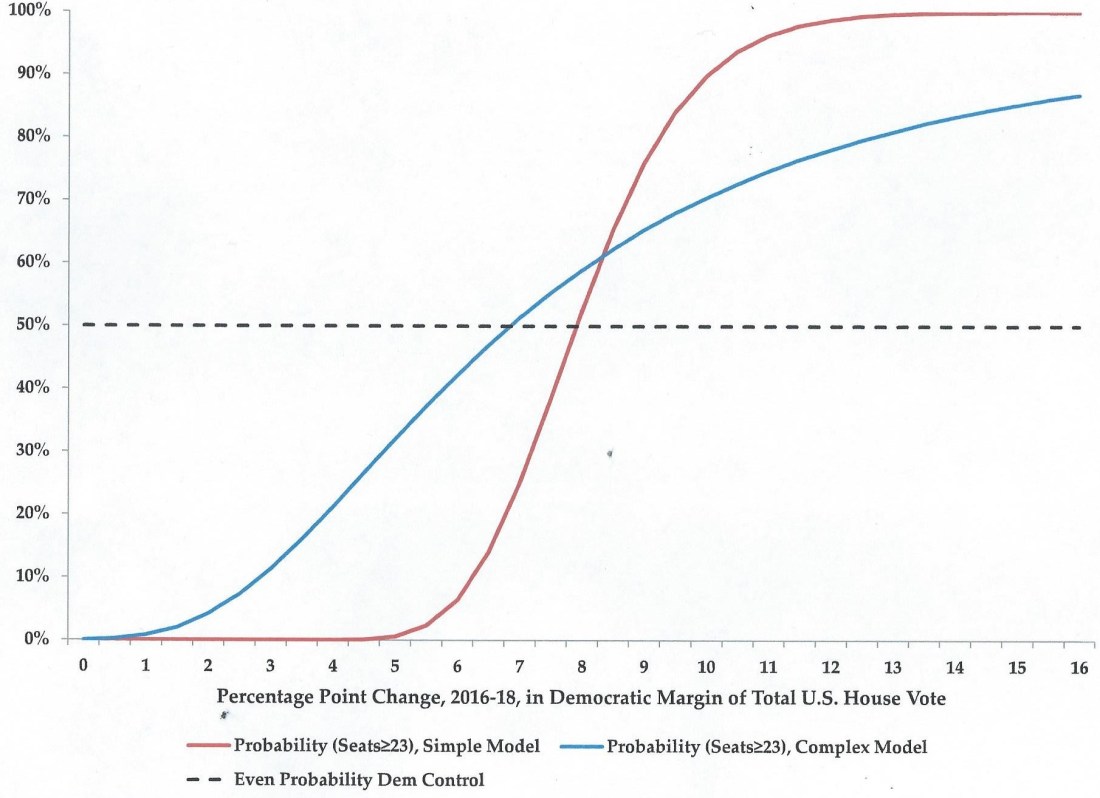
You may ask why I assessed change in margin rather than actual margin. The two values are correlated r=0.55, meaning that there is a relatively strong, linear association between them (i.e., more often than not, when one increases/decreases the other increases/decreases), so the models should be broadly similar.
The outcome of interest to me is whether Democrats net at least 23 House seats they did not win in 2016. For that to happen, Democratic 2016 margins must increase from, say, 0 to -15 points to between +15 to 0 points. Republicans won 31 House seats in 2016 by ≤15 points, so a uniform swing (i.e. margin in every CD changes an identical amount) of 15 points toward the Democrats would net them eight more House seats than they need.
But let’s say the swing is not uniform. Perhaps the 195 Democratic-held seats see no change in margin in 2018, while the 240 Republican-held seats see a uniform shift of 15 points. That equates to an 8.3 point overall margin shift toward the Democrats, still netting them 31 seats (by comparison, my two models show an 8.6 point change in Democratic margin netting them 24-28 House seats).
Now, I could simply compare the actual Democratic margin in the national House vote to the actual number of seats won. The simple model is:
Estimated Democratic seats = 217.92 + 4.61 * Democratic margin
And the more complex model is:
If Midterm: Estimated Democratic seats = 211.29 + 4.18 * Democratic margin + 9.877
If Presidential: Estimated Democratic seats = 211.29 + 5.90 * Democratic margin
Plugging the current FiveThirtyEight estimate (Democrats+6.5) into either model yields an estimated 248 Democratic House seats—a net gain of 53 seats! That is a far more optimistic projection that those estimated using change in Democratic margin (22-26).
Moreover, if the Democrats and Republicans simply break even in 2018 (1.1 point increase from 2016), the “actual margin” models would project a bare Democratic House majority (218-221 seats), a net gain of 23-26 seats. By contrast, the “change in margin” models would project a net Democratic gain of only 2-3 seats under this assumption.
Statistically speaking, all four models are valid and account for more than 80% of the variance in the independent variable (net seat gain, seats won), a very high value for such simple models. Various indicators,[3] meanwhile, suggest that the simpler models are a better fit to the data than the complex models.
For now, though, I stick with the “change in margin” models as they align more with other projections (and a back-of-the-envelope seat-by-seat examination) and have, to me, a stronger conceptual underpinning.
That leaves one final test of the “change in margin” models.
One way to test the reliability (measuring the same underlying concept over repeated measurements) of OLS regression models is to remove, say, 1970 data, then rerun the regression. You would use the new model to estimate the value for the missing data point. Doing this for all (or a random subset) of data points yields illustrative comparisons between actual and estimated value, as shown in Table 2.
Table 2: Estimated (after removing that year’s data) and actual net Democratic change in House seats, 1970-2016
| Year | % Point Change in Dem Margin | Actual Net Dem House Seats | Estimated –Actual Net Dem House Seats Model 1 | Estimated –Actual Net Dem House Seats Model 2 |
| 1970 | 6.8 | 12 | 8.2 | 12.6 |
| 1972 | -3.4 | -13 | 0.8 | 3.6 |
| 1974 | 11.4 | 49 | -17.9 | -13.6 |
| 1976 | -3.3 | 1 | -13.6 | -12.3 |
| 1978 | -4.7 | -15 | -1.3 | -1.5 |
| 1980 | -6.0 | -35 | 15.8 | 25.5 |
| 1982 | 9.1 | 27 | -0.4 | 4.5 |
| 1984 | -6.6 | -16 | -6.7 | -0.6 |
| 1986 | 4.8 | 5 | 8.9 | 12.4 |
| 1988 | -2.1 | 2 | -10.6 | -10.2 |
| 1990 | 0.1 | 7 | -8.7 | -7.6 |
| 1992 | -2.8 | -9 | -1.4 | 0.5 |
| 1994 | -12.0 | -54 | 17.9 | 16.6 |
| 1996 | 7.1 | 3 | 19.1 | 12.4 |
| 1998 | -1.2 | 4 | -9.8 | -9.2 |
| 2000 | 0.5 | 1 | -1.1 | -3.0 |
| 2002 | -4.3 | -8 | -7.4 | -7.8 |
| 2004 | 2.0 | -2 | 6.9 | 3.8 |
| 2006 | 10.5 | 31 | 0.1 | 5.6 |
| 2008 | 2.6 | 23 | -17.4 | -22.8 |
| 2010 | -17.2 | -63 | 11.0 | 6.6 |
| 2012 | 7.9 | 7 | 17.6 | 9.9 |
| 2014 | -7.1 | -12 | -12.8 | -14.5 |
| 2016 | 4.7 | 6 | 7.5 | 1.2 |
| Average, Raw Values | 0.2 | 0.5 | ||
| Average, Absolute Values | 9.3 | 9.1 | ||
| Average, Absolute Values, Midterms Only | 8.7 | 9.4 | ||
| Average, Absolute Values, Presidential Only | 9.9 | 8.8 | ||
In the final two columns, a positive value means Democrats underperformed their estimated net House seat gain, while a negative values means they overperformed. Democrats underperformed and overperformed on both models 11 times each. In 1982 and 1992, the Democrats slightly overperformed on the simple model and slightly underperformed on the complex model.
The largest underperformances (≥10.0 in either model) were in 1980, 1994, 1996, 2010 and 2012; three were wave years (1980, 1994, 2010) in which Democrats averaged a net loss of 54 House seats. Similarly, the largest overperformances were in 1974, 1976, 1988, 2008 and 2014; strong waves occurred in 1974 and 2008 (Dems+36, on average) and 2014 (Dems-12). The pattern is not perfect, however, as the model was fairly close in the wave year of 2006 (Dems+31), missing by an average of three seats. Still, in 10 of 24 elections, at least one model missed the actual net change in Democratic House seats by ≥10 seats.
On average, estimates were spot on, as overperformance and underperformance essentially cancel out. However, when you examine the absolute value (difference in either direction) of differences, the models do worse, averaging +/- 9 seats. The slight differences between midterm and presidential election years make little practical difference.
Applying these average differences to the current projections (change from 2016 in Democratic national House margin of 7.6 points) yields
Berger 1: 22.0 +/- 9.3 = 12.7 to 31.3 net Democratic House seats
Berger 2: 25.6 +/- 9.1 = 16.5 to 34.7 net Democratic House seats
Put another way: Democrats would need to win the national House vote by 9.8 points in the simple model, and by 8.5 points in the complex model, for the lower end of these projected ranges to be 23 seats (what Democrats need to net to control the House after the 2018 midterm elections).
This is not how a representative democracy is supposed to work.
Until next time…
[1] Using data from Dave Liep’s indispensable Atlas of U.S. Presidential Elections
[2] This extremely wide CI results from using only 24 data points to estimate three parameters.
[3] Among them adjusted r-squared, residual sums of squares, degrees of freedom.


I am learning a lot from you!
LikeLiked by 1 person
Glad to be of service. 🙂
LikeLiked by 1 person