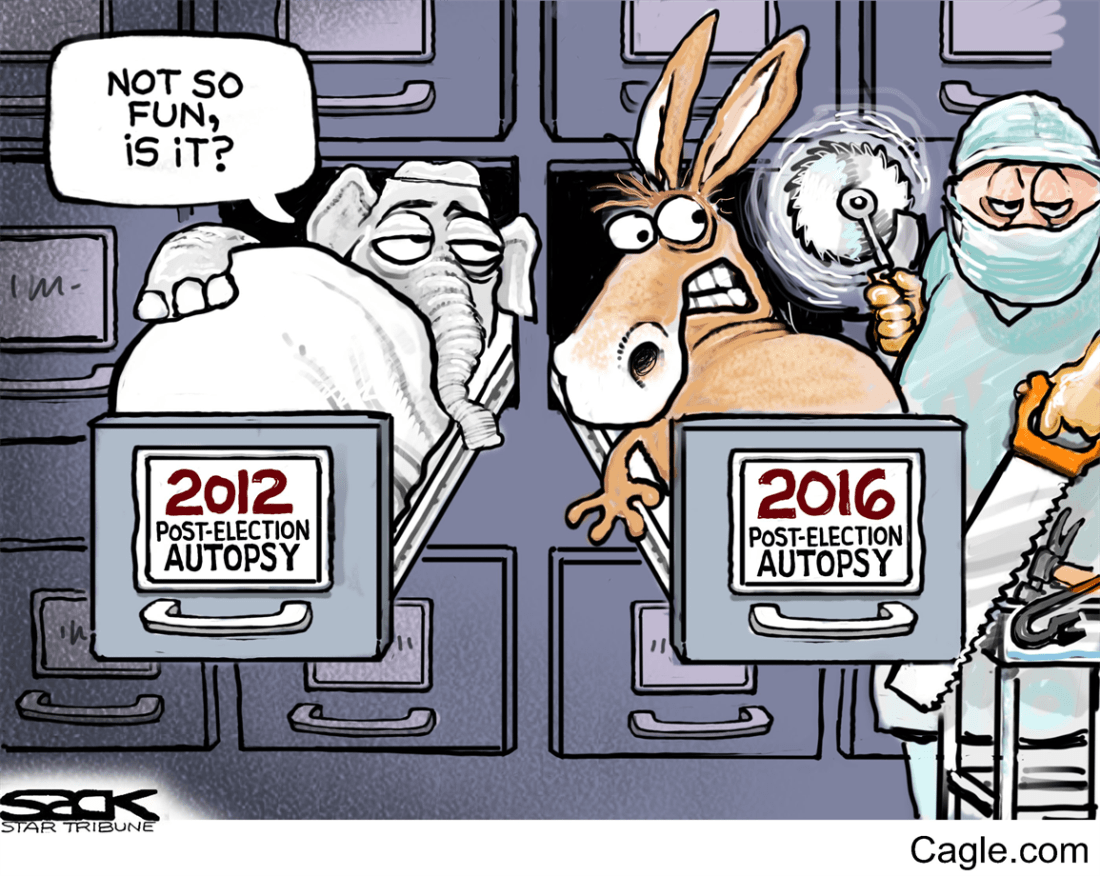
In the wake of Democratic underperformance in the 2016 elections (losing the Electoral College, insufficient gains to win back the United States House of Representatives [House] or United States Senate [Senate], net loss of two governorships, hemorrhaging state legislative seats), various “autopsies” were released.
Some autopsies reached conclusions that contradicted the finding of other autopsies (likely due to an inherent bias in the group conducting the autopsy). Left-leaning individuals (e.g., Bernie Sanders’ campaign manager Jeff Weaver) and groups (e.g., Center for American Progress) declared that the Democratic Party needed to be more responsive to its increasingly liberal and progressive base (in primaries, especially). The more centrist Third Way argued that liberals are still outnumbered by moderates and conservatives (though perhaps only in the Rust Belt states [Michigan, Ohio, Pennsylvania, Wisconsin] won by Republican presidential candidate Donald Trump). The race to be the next chairperson of the Democratic National Committee was seen as a proxy fight over this division, with Representative Keith Ellison representing the progressives and former Secretary of Labor Tom Perez representing the “establishment.” Perez won, 235-200, then immediately named Ellison deputy chairman in a nod toward party unity.
Other reports differed over whether Democrats should focus more on white men without a college degree or on younger and/or minority voters. I weighed in on this question here. And the data journalism website FiveThirtyEight.com framed their “post-mortem” in the context of what Democrats would expect in their 2020 president.
Given this apparent divide over the best way for Democrats to proceed, which encompasses everything from messaging to election targeting to fundraising to candidate recruitment, I thought it would be a useful exercise to review what self-identified Democrats actually believe right now (along with the Independents they will need to capture to, say, win back the House in 2018). That is, what issue positions, as measured by available public polling, distinguish a majority of self-identified, rank-and-file Democrats from a majority of self-identified, rank-and-file Republicans? And, in these cases, when do a majority of self-identified, rank-and-file Independents align with the Democrats?
**********
Just bear with me while I review my methodology.
I used all polls available on the Issues page of PollingReport.com. This page breaks down non-partisan, publicly-available, issue-oriented polls into 20 categories: Problems and Priorities, Abortion, Budget and Taxes, Crime, Disaster Preparedness and Relief, Education, Energy, Environment, Food, Foreign Affairs and Defense, Guns, Health Policy, Illegal Drugs, Immigration, Law, LGBT, Race and Ethnicity, Social Security, Space Exploration, Transportation. Some categories, such as Foreign Affairs and Defense, have subcategories (e.g., Isis and Terrorism).
For each issue, I collected all polls for which partisan breakdowns (Democrat, Republican, Independent) were provided, going back (when necessary) to the summer of 2014. In this way I balance opinion recency with the desire to review as wide an array of specific issues as possible, while also capturing data from both the Trump presidency and the preceding Barack Obama presidency.
There are three important caveats about these data.
One, poll respondents sometimes choose issue positions based on their partisan identification (as opposed to holding an independent, a priori position). An example of this is a November 2015 poll[1] asking respondents whether the unemployment rate had increased or decreased under President Obama. A bare majority, 53% of Republicans said it had increased, while 76% of Democrats correctly answered that it had decreased. The opinions of Independents were not provided.
A related caveat is that partisan positioning may have shifted over time, particularly following the 2016 presidential election.
Two, these are national polls and thus cannot be used to divine partisan issue divides in specific states or Congressional Districts.
Three, issue preference distinctions between parties may mask key distinctions within parties, such as on abortion.
Issues are presented in no particular order. If polls were conducted across multiple months, I use the last month the poll was in the field.
**********
Income inequality. Democrats (87%, vs. 11% opposed, +76) and Independents (60%, +31) felt in 2015[2] that wealth is not fairly distributed among Americans, that the federal government should seek remedies (D 81%, +66; I 54%, +13), including increasing taxes on the wealthy[3] (D 84%, +72; I 63%, +32); smaller majorities of Republicans do not see this inequality (51%, +9) and oppose governmental remedies (64%, +30), including higher taxes (55%, +17).
Environment. Democrats and Independents strongly support the Paris] Agreement, oppose federal support for coal mining, believe climate change is man-made and support government intervention to reverse it. Smaller majorities of Republicans are more skeptical of climate change, support economic growth over environmental protection and oppose government intervention to reverse climate change/reduce global warming.
Reality of climate change. Democrats (80%, +61 relative to “About the same”) and Independents (54%, +13) felt in April 2017[4] that there had been “More extreme or unusual weather in the United States” in the past few years, while Republicans (60%, +33) thought it had been “About the same.”
Government role in fighting climate change. An April 2017 poll[5] found that 91% (+84) of Democrats and 73% of Independents (+49) were OPPOSED to “significantly cutting for scientific research on the environment and climate change, while 50% (+5%) of Republicans felt the opposite.
When asked in September 2014 which should receive higher priority, environmental protection or economic growth, 63% of both Democrats (+29) and Independents (+32) prioritized the environment, while a bare majority of Republicans (51%, +11) chose economic growth.
Coal production and fossil fuels. An April 2017 poll[6] found a deep partisan divide, perhaps driven by President Trump’s vociferous support for coal miners, over whether the federal government should encourage or discourage coal production. Democrats (80%, +66) and Independents (58%, +23), seeking to protect the environment, strongly favored “discourage,” while Republicans (69%, +50), seeking to protect coal jobs and the economy, strongly favored “encourage.” Still, this is not likely to be a winning issue for Democrats in coal-producing states such as West Virginia, which Trump won by 41.7 percentage points.
When asked in April 2016[7], 71% (+48) and 56% (+21) of Independents thought it would be a good idea for colleges and universities to stop investing in fossil fuels to reduce “global warming.” A majority of Republicans (55%, +18) disagreed.
Paris Agreement. In December 2015[8], Democrats were overwhelmingly in favor (86%, +77) of the United States joining “an international treaty requiring America to reduce emissions in an effort to fight global warming,” with Independents only slightly less enthusiastic (66%, +41). Republicans, while opposed, were far more evenly divided (52%, +10).
However, in what could be an electoral artifact, by June 2017 a clear majority of Republicans (68%, +47; averaging three polls[9]) supported President Trump’s announced withdrawal from the Paris Agreement, while 85% (+78) of Democrats and 62% (+33%) of Independents were opposed.
Planned Parenthood. In a September 2015 poll[10], 82% (+70) of Democrats and 56% (+19) of Independents supported federal government support for Planned Parenthood. Technically, there were “opposed to cutting off” these funds. Republicans (71%, +46) preferred to cut off the funds.
Gun control/rights. There is near-unanimity across all partisan groups for universal background checks and preventing terrorists from acquiring guns, although when either issue is framed as something supported by President Obama, Republican support plummets. For some additional context, please see this post.
Gun sales. Between July 2015 and April 2017, CBS News asked[11] six times whether gun sales should be made more strict, less strict or kept as they are; for ease of presentation, I combined response for “less strict” and “kept as they are.” On average, 78% (+58) of Democrats thought gun laws should be made more strict; only 51% (+6) of Independents concurred. A solid 64% (+30) of Republicans, meanwhile, felt that gun laws should either be kept as they are (48%) or made less strict (16%). These results echo a June 2017 poll[12] in which 80% (+62) of Democrats and 54% (+12) of Independents support stricter gun control laws, with 68% (+41) of Republicans opposed.
Personal safety. Two polls (July 2016,[13] June 2017[14]), asked whether more guns or fewer guns would make the United States safer. Allowing for slight question wording differences: an average 82% (+70) of Democrats 50% (+10) of Independents said more guns would NOT make us safer; an average 70% (+48) of Republicans felt the opposite.
Perhaps reflecting the geographic self-segregation of Democrats into more urban areas and Republicans into more exurban and rural areas, Democrats (77%, +62) and Independents (64%, +36) in November 2015 said[15] they were more worried about being the victim of gun violence, while Republicans were more worried (barely: 50%, +5) about a terrorist attack.
Majorities of Democrats (82%, +69) and Independents (57%, +21) in October 2015[16] thought “better gun regulation” would reduce mass shooting, while 59% (+28) of Republicans favored “more people carrying guns.” Similarly, that some month[17], Democrats (79%, +60) and Independents (55%, +17) were opposed to “allowing more teachers and school officials to carry guns in schools,” while Republicans (64%, +30) were in favor.
Health care. Perhaps no issue divides Democrats and Independents from Republicans more than the 2010 Patient Protection and Affordable Care Act, more colloquially known as the ACA or Obamacare, despite widespread (if barely among Republicans) agreement that Americans with pre-existing conditions should not be charged more for their health insurance nor should Medicaid enrollment to pre-2010 levels[18]. There was also partisan accord, in February 2015[19], on requiring “parents to vaccinate their children for diseases like measles, mumps, and rubella.”
ACA. A series of polls[20] conducted between May and August 2017 found that nearly all Democrats (85-91%, +77-87) and most Independents (57-65%, +28-41) opposed Republican ideas to repeal-and-replace Obamacare, while Republicans (58-61%, +24-34) mostly favored these ideas.
At the same time, in April and July 2017[21], on average, Democrats (90%, +83) and Independents (69%, +42) overwhelmingly supported making improvements to the ACA. By contrast, Republicans favored (65%, +34) continuing repeal-and-replace efforts. An April 2017 poll[22], conducted before the House approved the American Health Care Act, echoed this sentiment.
Obamacare exchanges. In June 2015[23], “the Supreme Court ruled that government assistance for lower-income Americans buying health insurance through both state-operated and federally-operated health insurance exchanges is legal.” Two polls conducted that month[24] found that, on average, Democrats (84%, +72) and Independents (67%, +20) favored this governmental largesse, while Republicans were (barely) opposed (52%, +10).
Single payer/Medicare-for-all. An series of polls in June and August 2017 poll[25] found that, on average, most Democrats (75%, +59) and a majority of Independents (56%, +22) favored the expansion of Medicare to cover all Americans, with 60% (+29) of Republicans opposed.
Marijuana legalization. Three polls conducted between January 2014 and August 2017[26] found a strong partisan divide: on average, 63% (+31) of Democrats and 60% of Independents favored legalization, while 61% (+26) of Republicans were opposed. Interestingly, between 2014 and 2017, overall support for marijuana legalization increased from 51% (+7) to 61% (+28).
Immigration. This is an issue where it is difficult to separate support/opposition for/to President Trump from support/opposition for/to issues associated with him.
Border wall along southern United States border. In February 2017[27], this central tenet of Trump’s presidential campaign was opposed by most Democrats (87%, +70) and Independents (61%, +25) and just as strongly favored by Republicans (77%, +57).
Executive order suspending entrance from seven majority-Muslim nations for 90 days. Trump’s executive order induced a stark partisan divide in early February 2017[28] (Democrats split 88-9% opposed, Republicans split 88-11% in favor), with Independents (51%, +6) just barely in opposition. A similar partisan divide was apparent on the question of a 120-day suspension of all refugee immigration: fully 92% (+84) of Democrats and 64% (+33) of Independents were opposed and 75% (+53) of Republicans were in favor.
When asked in September 2016[29] whether one supported or opposed “a blanket ban on the immigration of any person who lives in a country where there has been a history of terrorism against the west,” 78% (+62) of Democrats and 61% (+32) of Independents were opposed, while 54% (+16) of Republicans supported the idea.
In polls conducted in December 2015[30] and July 2016[31], an average 80% (+64) of Democrats and 62% (+32) of Independents were opposed to a general Muslim ban, while Republicans (54%, +14) were somewhat in favor[32]. Other polls[33] released during this same time period had similar findings.
Illegal immigration from Mexico. In April 2016[34], when asked whether “you feel your own personal way of life is or is not under threat from illegal immigrants from Mexico,” fully 89% (+80) of Democrats and 68% (+38) of Independents, while Republicans were more evenly divided, 51-46%.
Syrian refugees. In November 2015[35], there was broad agreement (78-15% overall) that Syrian refugees should “go through a stricter security clearance process than they do now.” However, there was a partisan divide on the more general question of Syrian refugees coming to the United States. On average across two polls (November and December 2015[36]), Democrats (64%, +30) and (barely) Independents (50%, +4) were in favor (with the security clearance caveat cited above) and Republicans (72%, +48) were not in favor. And in September 2015[37], Democrats (69%, +40) and Independents (51%, +8) [38] favored increasing the number of Syrian refugees, while Republicans were opposed (67%, +37).
Islam. In February 2017[39], respondents were asked, “Generally speaking, do you think the Islamic religion encourages violence more than other religions around the world, less than other religions around the world, or about the same as other religions around the world?” Relative to “More,” Democrats (66%, +52) and Independents (53%, +25) chose “About the same;” relative to “About the same,” Republicans (63%, +38) chose “More.”
Use of military force. Going back a few years, a September 2014 poll found that more Democrats (59%, +23) and Independents (57%, +19) described themselves as “doves” (the United States should rarely or never use military force) and more Republicans (69%, +44) described themselves as “hawks” (military force should be used frequently to promote United States policy).
Equal protection under the law. I include here all LGBT and race/ethnicity questions.
Transgender. There is widespread agreement (75-23% overall, according to an April 2016 poll[40]) with “laws that guarantee equal protection for transgender people in jobs, housing and public accommodations.” However, that agreement does not extend to military service. In reaction to President Trump’s tweets about the subject, an August poll[41] found that Democrats (91%, +84) and Independents (72%, +49) strongly favored allowing transgender people to serve in the military, while Republicans (60%, +28) were opposed.
Same sex marriage. In three polls conducted between June and October 2015[42], an average of 67% (+41) of Democrats and 59% (+29) of Independents felt same sex marriage should be legal, with 56% (+20) of Republicans feeling it should not be legal (despite the June 2015 Supreme Court ruling, Obergefell v. Hodges, legalizing same sex marriage in all 50 states).
Religious exemptions. Two April 2015 polls[43] queried the right of businesses to refuse service to LGBT customers on religious grounds, potentially violating anti-discrimination laws. The question wording was slightly different, but on average Democrats (74%, +52) and Independents (60%, 25%) opposed these exemptions and Republicans (62%, +34) supported them.
Voting Rights Act. A February 2015 poll[44] asked whether the Voting Rights Act (VRA) was still necessary “to make sure that blacks are allowed to vote.” There were two interesting divides on this question. First, Democrats (62%, +24) and Independents (52%, +5) thought the VRA was still necessary, while Republicans (61%, +24) did not. Second, and perhaps more telling, fully 76% (+53) of black respondents thought the VRA was still necessary, while white respondents split 48-50 against.
**********
In sum, majorities of rank-and-file Democrats and Independents (in opposition to majorities of rank-and-file Republicans)…
…believe wealth is not fairly distributed among Americans and the federal government should seek remedies, including increasing taxes on the wealthy.
…support the Paris Agreement, oppose federal support for coal mining and believe climate change is both real and man-made (with government intervention required to reverse it).
…strongly support federal funding of Planned Parenthood
…feel gun laws should be more strict, more guns will not make us safer (Independents more evenly divided), more worried about being the victim of gun violence than of terrorism, better gun regulation would reduce mass shooting (not more people carrying guns) and oppose allowing more teachers and school officials to carry guns in schools.
…strongly opposed efforts to repeal-and-replace Obamacare (opting overwhelmingly to fix the law), supported government assistance for lower-income Americans buying health insurance through state and federal health insurance exchange and favored a Medicare-for-all/single payer health insurance system.
…support the legalization of marijuana
…oppose building a wall on the southern border of the United States and any form of “Muslim ban,” feel that illegal immigration from Mexico has not hurt their way of life and support Syrian refugees entering the United States (under stricter security clearance)
…have (relatively) more benign views of Islam
…feel the United States should rarely or never use military force to promote policy.
…support allowing transgender people to serve in the military and same sex marriage, while opposing allowing businesses to refuse service to LGBT persons on religious grounds.
…and believe the Voting Rights Act is still necessary to protect ballot access.
Let the campaigns begin!
Until next time…please wear a mask as necessary to protect yourself and others – and if you have not already done so, get vaccinated against COVID-19! And if you like what you read on this website, please consider making a donation. Thank you.
[1] Bloomberg Politics Poll conducted by Selzer & Company. Nov. 15-17, 2015. N=1,002 adults nationwide. Margin of error ± 3.1.
[2] CBS News Poll. July 29-Aug. 2, 2015. N=1,252 adults nationwide. Margin of error ± 3.
[3] CBS News/New York Times Poll. Nov. 6-10, 2015. N=1,495 adults nationwide. Margin of error ± 3.
[4] Quinnipiac University. March 30-April 3, 2017. N=1,171 registered voters nationwide. Margin of error ± 2.9
[5] Quinnipiac University. March 30-April 3, 2017. N=1,171 registered voters nationwide. Margin of error ± 2.9.
[6] Quinnipiac University. March 30-April 3, 2017. N=1,171 registered voters nationwide. Margin of error ± 2.9.
[7] 60 Minutes/Vanity Fair Poll. March 30-April 3, 2016. N=1,010 adults nationwide. Margin of error ± 4.
[8] Quinnipiac University. Dec. 16-20, 2015. N=1,140 registered voters nationwide. Margin of error ± 2.9.
[9] NPR/PBS NewsHour/Marist Poll. June 21-25, 2017. N=995 registered voters nationwide. Margin of error ± 3.1; Quinnipiac University. May 31-June 6, 2017. N=1,361 registered voters nationwide. Margin of error ± 3.2; ABC News/Washington Post Poll. June 2-4, 2017. N=527 adults nationwide. Margin of error ± 5
[10] Quinnipiac University. Sept. 17-21, 2015. N=1,574 registered voters nationwide. Margin of error ± 2.5.
[11] CBS News Poll. April 21-24, 2017. N=1,214 adults nationwide. Margin of error ± 3.
[12] Quinnipiac University. June 22-27, 2017. N=1,212 registered voters nationwide. Margin of error ± 3.4.
[13] McClatchy-Marist Poll. July 5-9, 2016. N=1,053 registered voters nationwide. Margin of error ± 3.
[14] Quinnipiac University. June 22-27, 2017. N=1,212 registered voters nationwide. Margin of error ± 3.4.
[15] McClatchy-Marist Poll. Oct. 29-Nov. 4, 2015. N=1,465 adults nationwide (margin of error ± 2.6), including 1,080 registered voters (± 3).
[16] Fairleigh Dickinson University’s PublicMind. Oct. 1-5, 2015. N=771 adults nationwide. Margin of error ± 4.2.
[17] CBS News/New York Times Poll. Oct. 21-25, 2015. N=1,289 adults nationwide. Margin of error ± 4.
[18] Politico/Harvard T.H. Chan School of Public Health. June 14-18, 2017. N=501 adults nationwide. Margin of error ± 5.3.
[19] CBS News Poll. Feb. 13-17, 2015. N=1,006 adults nationwide. Margin of error ± 3.
[20] Quinnipiac University. July 27-Aug. 1, 2017. N=1,125 registered voters nationwide. Margin of error ± 3.4; Kaiser Family Foundation. July 5-10, 2017. N=1,183 adults nationwide. Margin of error ± 3.
[21] ABC News/Washington Post Poll. April 17-20, 2017. N=1,004 adults nationwide. Margin of error ± 3.5.Margin of error ± 3.4; Kaiser Family Foundation. July 5-10, 2017. N=1,183 adults nationwide. Margin of error ± 3
[22] Quinnipiac University. April 12-18, 2017. N=1,062 registered voters nationwide. Margin of error ± 3.
[23] CNN/ORC Poll. June 26-28, 2015. N=1,017 adults nationwide. Margin of error ± 3.
[24] CNN/ORC Poll. June 26-28, 2015. N=1,017 adults nationwide. Margin of error ± 3; CBS News/New York Times Poll. June 10-14, 2015. N=1,007 adults nationwide. Margin of error ± 3.
[25] Quinnipiac University. July 27-Aug. 1, 2017. N=1,125 registered voters nationwide. Margin of error ± 3.4; Quinnipiac University. June 22-27, 2017. N=1,212 registered voters nationwide. Margin of error ± 3.4.
[26] CBS News Poll. April 8-12, 2015. N=1,012 adults nationwide. Margin of error ± 3.; Quinnipiac University. July 27-Aug. 1, 2017. N=1,125 registered voters nationwide. Margin of error ± 3.4.
[27] CBS News Poll. Feb. 17-21, 2017. N=1,280 adults nationwide. Margin of error ± 3.
[28] Quinnipiac University. Feb. 2-6, 2017. N=1,155 registered voters nationwide. Margin of error ± 2.9.
[29] Monmouth University Poll. Sept. 22-25, 2016. N=802 registered voters nationwide. Margin of error ± 3.5.
[30] Quinnipiac University. Dec. 16-20, 2015. N=1,140 registered voters nationwide. Margin of error ± 2.9.
[31] CBS News/New York Times Poll. July 8-12, 2016. N=1,358 registered voters nationwide. Margin of error ± 3.
[32] By September 2016, opposition to the proposed Muslim ban had ceased to be a partisan issue. A Monmouth University Poll (Sept. 22-25, 2016. N=802 registered voters nationwide. Margin of error ± 3.5) found Republicans opposed 54-32%.
[33] McClatchy-Marist Poll. July 5-9, 2016. N=1,053 registered voters nationwide. Margin of error ± 3; Quinnipiac University. June 21-27, 2016. N=1,610 registered voters nationwide. Margin of error ± 2.4; ABC News/Washington Post Poll. Dec. 10-13, 2015. N=1,002 adults nationwide. Margin of error ± 3.5. Across these three polls, average Democratic opposition was 81%, average Independent opposition was 59% and average Republican support was 64%.
[34] Monmouth University Poll. Aug. 4-7, 2016. N=803 registered voters nationwide. Margin of error ± 3.5.
[35] CBS News Poll. Nov. 19-22, 2015. N=1,205 adults nationwide. Margin of error ± 3.
[36] CBS News/New York Times Poll. Dec. 4-8, 2015. N=1,275 adults nationwide. Margin of error ± 3.
[37] Pew Research Center. Sept. 22-27, 2015. N=1,502 adults nationwide. Margin of error ± 2.9.
[38] Interestingly, a majority of Independents (58%, +21) in a November 2015 Gallup poll (Nov. 20-21, 2015. N=1,013 adults nationwide. Margin of error ± 4) were opposed to the specific number of 10,000 or more refugees proposed.
[39] CBS News Poll. Feb. 1-2, 2017. N=1,019 adults nationwide. Margin of error ± 4.
[40] CNN/ORC Poll. April 28-May 1, 2016. N=1,001 adults nationwide. Margin of error ± 3.
[41] Quinnipiac University. July 27-Aug. 1, 2017. N=1,125 registered voters nationwide. Margin of error ± 3.4.
[42] CBS News/New York Times Poll. Oct. 21-25, 2015. N=1,289 adults nationwide. Margin of error ± 4.
[43] Quinnipiac University. April 16-21, 2015. N=1,353 registered voters nationwide. Margin of error ± 2.7; CNN/ORC Poll. April 16-19, 2015. N=1,018 adults nationwide. Margin of error ± 3.
[44] CNN/ORC Poll. Feb. 12-15, 2015. N=1,027 adults nationwide (margin of error ± 3), including 733 non-Hispanic whites (± 3.5), and, with an oversample, 309 blacks (± 5.5).

3 thoughts on “Where do rank-and-file Democrats (and Independents) stand on issues right now?”