During the 2016 campaign, I was struck by two overlapping narratives.
One was the intensity of animus toward Democratic presidential nominee Hillary Clinton, particularly among Republicans. This felt to me less like policy disagreement and more like personal vendetta. This animus expressed itself manufactured outrage (and HOURS of Congressional hearings) over the Islamist militant attack on the U.S. diplomatic mission in Benghazi, Libya on September 11, 2012 and the use of a private e-mail server while serving as President Barack Obama’s first Secretary of State. While neither Benghazi nor the e-mail server cast Ms. Clinton in the best possible light, the obsessive focus on them as somehow criminal acts (leading to chants of “Lock her up!” at the 2016 Republican National Convention) smacked of political overkill. Thus, the adjective “manufactured.”
To me, this animus echoed the fervor with which Republicans had gone after her husband, Bill Clinton, while he served as president of the United States. The Whitewater-Lewinsky investigations, which ran (with brief stoppages due to lack of evidence) from January 1994 to Clinton’s acquittal by the United States Senate (Senate) on February 12, 1999, were an earlier manifestation of what I will call “Clinton derangement.”
Two was the emergence, led by Donald Trump, of a virulent strain of raw nationalist populism, driven by mass rallies, calls for violence against journalists and protestors, and anti-elitist resentments (aimed at the establishments of both major political parties). Trump encouraged this nationalist populism through outrageous, often vulgar statements and Twitter musings, culminating in the Access Hollywood audiotape, released on October 7, 2016, on which Trump appears to brag about sexually assaulting women.
So, you ask, where is the overlap?
Well, consider the curious case of U.S. House of Representatives (House) member Jason Chaffetz (R-UT).
Immediately after the release of the Access Hollywood audiotape, Rep. Chaffetz announced that he was no longer supporting Trump’s presidential candidacy. His reason, passionately expressed during a media blitz, was that he could not explain to his 15-year-old daughter how he could support someone who utters “some of the most abhorrent and offensive comments that you can possibly imagine.”
Just 19 days later, however, Rep. Chaffetz tweeted this: “I will not defend or endorse @realDonaldTrump, but I am voting for him. HRC is that bad. HRC is bad for the USA.”
I wonder how that second conversation between Rep. Chaffetz and his 15-year-old daughter went.
In short: for Republicans, no matter how “abhorrent” (Rep. Chaffetz’s word) or “reprehensible” (the word of a Republican cousin-by-marriage who still voted for Trump) Trump’s behavior or how far he strayed from Republican orthodoxy, Hillary Clinton was somehow simply worse.
I wrote “strayed from Republican orthodoxy,” but the reality is that the nationalist populism embraced by Trump already existed among a significant segment of Republican voters.
Simply put, Trump did not create his voters, his voters created him.
**********
The more I thought about these two strands, Clinton derangement and an evolving Republican strain of nationalist populism, the more I found myself thinking about the presidential election of 1992 (and the subsequent midterm elections of 1994).
And an argument began to take shape in my mind, one that greatly clarifies both Trump’s emergence and Clinton’s defeat:
- With the elections of 1992 and 1994, the Democratic and Republican Parties switched governing roles. The Democratic Party went from being primarily a Congressional and state-house party to primarily a national (i.e., White House) party, while the Republican Party went in the opposite direction.
- Republicans blamed Bill Clinton for breaking their iron grip on the White House, and they have been punishing him (and his wife) for it ever since.
- The Republican Party underwent a profound transformation in the aftermath of the first Bush presidency (1989-93) as a result of both internal actions (e.g., Bush breaking his “read my lips” pledge not to raise taxes) and external events (e.g., the end of the Cold War). The common enemy (the Soviet Union) which had held together the disparate ideologies of the Republican Party for 25 or 30 years vanished, and previously dormant “fringe” factions asserted themselves.
- This newly radical Republican Party was characterized in part by a nationalist populism (embodied by Pat Buchanan) and a resentful anti-government ethos (embodied by Georgia Republican Congressman Newt Gingrich). And they had a new common enemy: the Clintons.
I will explore these arguments over a series of posts, beginning with this one.
*********
Just bear with me while I present three election data “items” related to the 1992 and 1994 elections.
Item 1.[1]
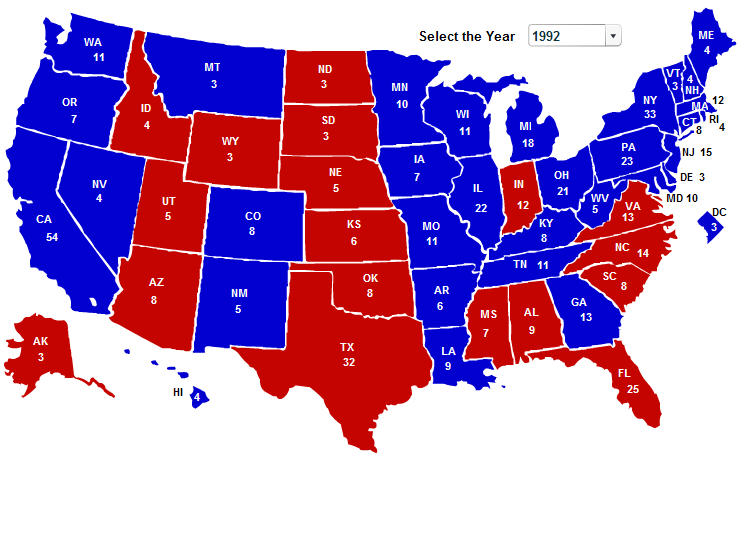
On Tuesday, November 3, 1992, Clinton captured 43.0% of the popular vote cast for president, 5.6 percentage points more than G. H. W. Bush (37.4%) and 24.0 percentage points more than Independent H. Ross Perot (19.0%). Considering only votes cast for the Democratic and Republican presidential candidates (“two-party vote”), Clinton beat Bush 53.5 to 46.5%.
Clinton also won 32 states, plus the District of Columbia (DC), for a total of 370 electoral votes (EV); Bush received only 168 EV.
Four years earlier, however, G. H. W. Bush had won 53.4% of the popular vote against Democrat Michael Dukakis (45.6%), winning 40 states and 426 EV; Bush beat Dukakis 53.9 to 46.1% in the two-party vote. Bush’s near-landslide victory (in the Electoral College, anyway) meant that Republicans would control the White House for a third consecutive four-year term.
 In other words, in just four years, Democrats had increased their share of the two-party popular vote by 7.4 percentage points, flipped 22 states from Democratic to Republican, and increased their EV total from 112 to 370.
That is an astonishing turnaround.
Item 2.
Following the 1992 elections, Democrats controlled 57 Senate seats and 258 House seats, while 30 of the nation’s governors were Democrats.
Just two years later, following the 1994 midterm elections, Democrats controlled 48 Senate seats and 204 House seats; only 19 governors were Democrats.
Put differently, just two years after Democrats regained control of the White House for the first time in 12 years, Democrats were absolutely slaughtered in Congressional and gubernatorial races, losing a net nine Senate seats, 54 House seats and 11 governor’s mansions.
That is not a turnaround. That is whiplash.
Item 3a.
Table 1: Summary of Democratic performance in Presidential, Congressional and gubernatorial races: 1968-2016
| Presidency | 1968 – 1988
(24 years) |
1992 – 2016
(28 years*) |
Post-1988 Change |
| Average % Total Vote | 42.9% | 48.7% | D+5.8 perc pts |
| Average % 2-Party Vote | 45.1% | 52.0% | D+6.9 perc pts |
| Average #Electoral Votes | 113.0 | 313.4 | D+200.4 EV |
| Average States Won | 9.0 (+DC) | 23.7 (+DC) | D+14.7 states |
| Victories | 1 | 4†† | D+3 wins |
| Years in White House | 4 | 16 | D+12 years |
| Senate | 1968-1992
(26 years) |
1994-2016
(24 years†) |
Post-1992 Change |
| Average % Total Vote | 51.2% | 48.8% | D-2.4 perc pts |
| Average % 2-Party Vote | 53.0% | 51.2% | D-1.8 perc pts |
| Average # Seats | 54.5 | 48.3 | D-6.2 seats |
| Years in Majority | 20 | 9.5 | D-10.5 years |
| House | |||
| Average % Total Vote | 52.9% | 47.4% | D-5.5 perc pts |
| Average % 2-Party Vote | 54.1% | 49.6% | D-4.5 perc pts |
| Average # Seats | 262.1 | 208.7 | D-53.4 seats |
| Years in Majority | 26 | 4 | D-22 years |
| Governor | |||
| Average % Total Vote | 51.7% | 46.7% | D-5.0 perc pts |
| Average % 2-Party Vote | 52.9% | 48.8% | D-3.9 perc pts |
| Average # State Houses | 31.0 | 20.7 | D-10.3 state houses |
| Years in Majority | 26 | 4 | D-22 years |
*Through 2020
†Through 2018
††Excluding popular vote victories by Al Gore in 2000 and Hillary Clinton in 2016
In the six presidential elections from 1968 through 1988 (Table 1), Republicans won the presidency five times, four times by landslides (1972, 1980, 1984) or near-landslides (1988). The one Democratic victor was Jimmy Carter in 1976, in the wake of Republican President Richard Nixon’s Watergate-related resignation in August 1974, Nixon’s pardon by his successor (Gerald Ford) and various Ford gaffes. Still, Carter only managed to beat Ford by 2.1 percentage points (50.1 to 48.0%) and 57 EV (297-240[2]); Ford actually won more states: 27 to 23 (plus DC). In fact, had Ford flipped 5,559 votes in Ohio (25 EV) and 7,232 votes in Mississippi (7 EV)—just 12,791 votes out of 81,540,780 cast, he would have won 272 EV and held on to the presidency.
Overall in those six presidential elections, the Democratic candidates averaged 42.9% of the popular vote (45.1% of the two-party vote), victories in nine states (plus DC) and 113.0 EV. The White House essentially “belonged” to the Republicans during this period.
During the same time period, however, Democrats controlled the House and held a majority of governorships. They controlled the Senate for 18 of 24 years, excepting only 1981-87. Following the 13 even-numbered elections from 1968 through 1992, Democrats averaged majorities of all votes cast for Senate, House and governor[3], for an average of 54.5 Senate seats, 262.1 House seats and 31.0 governor’s mansions.
In other words, from 1968 through 1992, while Republicans held a near lock on the White House, Democrats controlled Congress (both Houses for 20 years) and a majority of governor’s mansions. One interpretation is that voters preferred Republicans in the White House to conduct foreign policy (i.e., fight the Cold War) and preferred Democrats to manage domestic affairs (i.e., protect entitlements).
Item 3b.
AFTER 1992, however…
In the seven presidential elections from 1992 through 2016, Democrats won the presidential popular vote six of seven times (despite only winning the Electoral College—and thus the White House—four times), the exception being 2004, when Republican George W. Bush won reelection by 2.4 percentage points (50.7 to 48.3%) over Democrat John Kerry, capturing 286 EV to Kerry’s 251.[4] Once again, Ohio was pivotal. If Kerry could have flipped 59,188 votes there (out of 122,303,590 cast nationwide), he would have won 271 EV and the presidency (though he still would have lost the popular vote).
Overall in those seven presidential elections, the Democratic candidates averaged 48.7% of the popular vote (52.0% of the two-party vote), victories in 23.7 states (plus DC) and 313.4 EV.
Meanwhile, since January 1995, Democrats have only controlled the House and held a majority of governorships for four years (2007-11), while controlling the Senate for only nine-plus years (May 2001[5]-January 2003, 2007-15). Following the 12 even-numbered elections from 1994 through 2016, while Democrats managed rough parity in Senate votes, they lost the overall vote for House and governor, earning an average 48.3 Senate seats, 208.7 House seats and 20.7 governor’s mansions.
The overall lower average of EV won by White House winners and the near-parity in Senate votes means that the more recent differentiation between Democrats as “White House” party and Republicans as “Congressional/gubernatorial” party is not quite as apparent.
Figure 1. Democratic % Presidential Popular Vote, U.S. Senate Vote, U.S. House Vote, Governor Vote: 1968-2016
Democratic % President, Senate, House, Governor, 2-party, 1968-2016
Figure 2. Democratic % Electoral Votes, U.S. House Seats, U.S. Senate Seats, Governorships: 1968-2016
Democratic % EV, Senate Seats, House Seats, Governors, 1968-2016
The Democratic presidential victory in 1976, Republican presidential victories in 2000 and 2004, and Democratic successes across the board in 2006 and 2008 obscure the trends in Figure 1 (Democratic percentages of the two-party vote cast for president, Senate, House and governor, 1968 through 2016) and Figure 2 (Democratic percentages of EV, Senate and House seats, and governorships, 1968 through 2016). However, the dramatic shift in governing roles (“national” vs. “legislative”) can still be discerned, especially in Figure 2, which focuses on the winning of control-determining EV, Congressional seats and governor’s mansions.
Figures 3 and 4 clarify the 1992-94 governing role shift by displaying, for each presidential election, the average of the Democratic results in that election and the previous one, and for each set of Senate, House and (two-year cycle) gubernatorial elections, the average of the Democratic results in that election and the previous two elections. In other words, each value in Figures 3 and 4 encompasses an identical rolling three-even-year-elections time frame.
Figure 3. Democratic % Presidential Popular Vote, U.S. Senate Vote, U.S. House Vote, Governor Vote: 6-Year Rolling Averages, 1968-2016
Democratic % President, Senate, House, Governor, 2-party, 6-yr-ave, 1968-2016
Figure 4. Democratic % Electoral Votes, U.S. Senate Seats, U.S. House Seats, Governorships: 6-Year Rolling Averages, 1968-2016
Democratic % EV, Senate Seats, House Seats, Governors, 6-yr-ave, 1968-2016
The dramatic shift in party governing roles in 1992-94 is now strikingly clear, especially in Figure 4. What is also readily apparent is just how poorly Democrats have been faring in governor’s races since 1992. I have written elsewhere about the current extreme Republican advantage in governor’s mansions (16 Democratic, 33 Republican, 1 Independent). As Figures 2 and 4 show, the gap was not very different in the mid-to-late 1990s, during which Democrats held an average of only 18 governor’s mansions.
In a subsequent post, I will examine the defining events of 1988 through 1994 in more detail, moving from then-Vice-President G. H. W. Bush’s acceptance speech at the 1988 Republican National Convention through the wildly successful (for Republicans) 1994 midterm elections. I will follow that post with one in which I theorize about how resentment at Bill Clinton’s 1992 (and 1996) electoral successes and the Republican Party’s shift from “national” to “legislative” party may have resulted in the “surprising” 2016 elections.
Until next time…
[1] All presidential and Congressional election are from Dave Leip’s indispensable Atlas of U.S. Presidential Elections, as are 1990-2016 gubernatorial election data. Gubernatorial data from 1967 to 1989 from the equally invaluable OurCampaigns.
[2] Ronald Reagan, who had challenged Ford for the Republican nomination, won the remaining EV, cast by a Washington state elector.
[3] Five states still hold gubernatorial elections in odd-numbered years: Kentucky, Louisiana and Mississippi (next election: 2019), and New Jersey and Virginia (next election: 2017). To maintain consistency with presidential and Congressional elections, I combined the election results for gubernatorial elections held in even-numbered years with those held in the preceding odd-numbered year.
[4] Democratic Vice-Presidential nominee John Edwards won the remaining EV, cast by a Minnesota elector.
[5] On May 24, 2001, Republican Senator Jim Jeffords of Vermont switched to “Independent,” turning a 50-50 Senate tie, broken by Republican Vice President Dick Cheney into a 50-49 Democratic edge. In the subsequent 2002 midterms, however, Democrats lost a net of two seats, giving the Republicans a 51-48-1 edge.


6 thoughts on “Clinton Derangement, or The Birth of a Notion”