I debuted this blog 11 months ago yesterday as a place to tell what I hoped would be entertaining and informative data-driven stories. Given my proclivity for, and advanced academic training in, quantitative data analysis, the vast majority of my 47 prior posts have involved the rigorous and systematic manipulation of numbers.
But not all data are quantitative. Sometimes they are “qualitative,” or simply impressionistic.
A few weeks ago, I wrote a post about my impending trip to Atlanta to attend the American Public Health Association (APHA) Annual Meeting and Expo. This post served two purposes:
- To allow me to archive online:
- The full text (minus Acknowledgments and CV) of my doctoral thesis (Epidemiology, Boston University School of Public Health, May 2015)
- The PowerPoint presentation I delivered in defense of that thesis (minus some Acknowledgment slides) in December 2014
- Both oral presentations I delivered at the APHA Meeting
- To explore the idea that the decision to change careers (which I detail here) actually began two years earlier than I thought, with the completion of this doctorate.
I submitted three abstracts to APHA (one for each dissertation study) when I was still looking for ways to jumpstart my health-data-analyst job search (and my flagging interest in the endeavor). I was shocked that any of my abstracts were accepted for oral presentation (if only because I had no institutional affiliation) and quite humbled that two were accepted.
Once they were accepted, though, I felt an obligation to prepare and deliver the two oral presentations, despite the fact that I had decided to embark on a different career path.
(I did, however, truncate the length of my attendance from all four days to only the final two days, the days on which I was scheduled to give my presentations.)
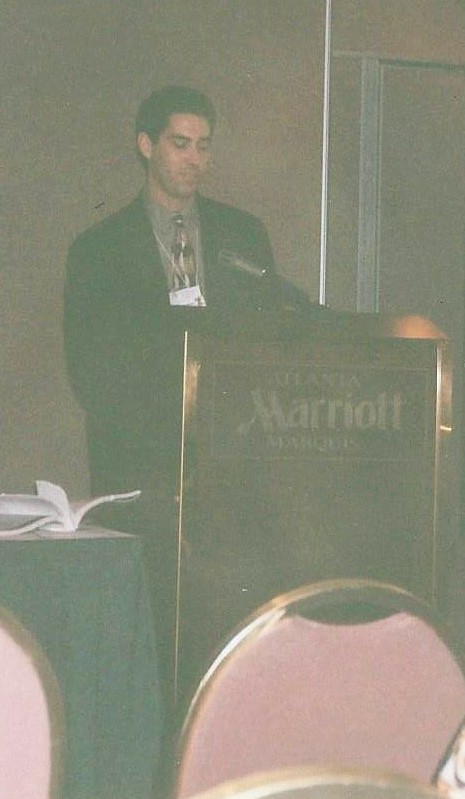
I also recalled how much I used to enjoy attending APHA Meetings with my work colleagues. My first APHA Meeting—Atlanta, October 2001—was also the place I delivered an oral presentation to a large scientific conference for the first time.
**********
There are two interesting coincidences related to this presentation.
One, I gave this presentation at the Atlanta Marriott Marquis, the same hotel in which I just stayed for the 2017 APHA Meeting[1].
Two, the presentation itself—GIS Mapping: A Unique Approach to Surveillance of Teen Pregnancy Prevention Efforts (coauthored with my then-supervisor)—drew upon a long-term interest of mine: what you might call “geographical determinism,” which is a pretentious way of saying that “place matters.”
To explain, just bear with me while I stroll down a slightly bumpy memory lane.
I have always loved maps—street maps, maps of historical events, atlases, you name it. As a political science major at Yale, I discovered “electoral geography.” At one point while I was working as a research assistant for Professor David Mayhew, I mentioned the field to him.
Hmm, he responded. I should teach a course about that next semester.
He did.
I still have the syllabus.
As a doctoral student at Harvard (the doctorate I did NOT finish), I formulated a theory for my dissertation about why some areas tended to vote reliably Democratic while others tended to vote reliably Republican that was based on the way demographic traits (e.g., race, socioceconomic status [SES], religion) were distributed among an area’s population. The idea was that because everyone has a race AND an age AND a gender AND a SES level AND a religion AND so on, the areal distribution of these traits makes some more politically salient than others in that area.
Well…it all made perfect sense to me back in the early 1990s.
Because this was not already complicated enough to model and measure, I originally chose to test this theory using data from presidential primary elections, with all of their attendant flukiness. I even spent a pleasant afternoon in Concord, New Hampshire collecting (hand-written) town-level data on their 1976 presidential primary elections.
Did I mention that New Hampshire has 10 counties, 13 cities, 221 towns, and 25 unincorporated places?
From the start, however, it was an uphill battle getting this work taken seriously[2]. One of the four components of my oral exams in May 1991 was a grilling on the electoral geography literature review I had recently completed.
Rather than ask me questions about (for example) J. Clark Archer’s work on the geography of presidential elections, however, the professor who would soon chair my doctoral committee peppered me with questions about why we should study political/electoral geography when academic geography departments were closing or what James Madison’ antipathy to faction said about viewing elections through the lens of geography.
I have no recollection of how I answered those questions, but I know that I passed those exams by the skin of my teeth[3].
(Ironically, just nine years later, the nation would be riveted by Republican “red states” and Democratic “blue states” during the Florida recount that decided the 2000 presidential election between Texas Governor George W. Bush and Vice President Al Gore).
The real kicker, though, came a year later.
Harvard at the time had a program with a name like “sophomore seminars.” These small-group classes were a chance for doctoral students to prepare and teach a semester-length seminar of their own design to undergraduate political science majors.
I eagerly jumped at the chance and applied to teach one in American electoral geography, drafting a syllabus in the process. Once it was accepted, I organized the first class, including getting permission to copy a Scientific American article, which I then made copied.
Towards the end of the summer, they posted (I do not remember where, but it was 1992, so it was literally a piece of paper tacked to a bulletin board) the names of the students who would be taking each seminar.
I looked for my class.
I could not find it.
I soon discovered why. Only one student had signed up (and it was not even her/his first choice), so the seminar had been cancelled.
That was one of the most crushingly disappointing moments of my life.
In retrospect, this was most likely when my interest in completing this doctoral program began to seriously wane—even though I stuck it out for three more years.
(In a bittersweet bit of irony, five years after I walked away from that doctoral program came the 2000 U.S. presidential election. Because of the month-long Florida recount, the “red state-blue state” map of the election burned into the public consciousness. Electoral geography, at least at this very basic level, suddenly became a “thing.” To this day, there is talk of “red,” “blue” and even “purple” states.)
The good news was that the idea of looking at data geographically still appealed to me tremendously, and I was lucky enough to be able to learn and use ArcGIS mapping software in my first professional job as a health-related data analyst. The best moment in this regard there came when I produced a town-level map of alcohol and substance use problems in Massachusetts. The towns with the most severe issues were colored in red, and I noticed that they followed two parallel east-west lines emanating from Boston, and that they were crossed by a north-south line in the western part of the state.
Oh, I exclaimed. The northern east-west line is Route 2, the southern east-west line is I-90 (the Massachusetts Turnpike) and the intersecting north-south line is I-91. Of course, these are state-wide drug distribution routes.
Three professional positions later, temporarily living in Philadelphia, I was doing similar work, but now in the area of teen pregnancy–which brings us back to the oral presentation I delivered late on the afternoon of November 7, 2017 and to the second coincidence.
Its title was “Challenges in measuring neighborhood walkability: A comparison of disparate approaches,” and it was the second presentation (of six) in a 90-minute-long session titled Geo-Spatial Epidemiology in Public Health Research.
In other words, 16 years after my first APHA oral presentation, in the same city, I was once again talking about ways to organize and analyze data geographically.
And while the five-speaker session in which I spoke the following morning (Social Determinants in Health and Disease) was not “geo-spatial,” per sé, the study I discussed (“Neighborhood walkability and depressive symptoms in black women: A prospective cohort study”) did feature a geographic exposure.
**********
I again coauthored and delivered oral presentations at the APHA Meetings in 2002[4] (Philadelphia) and 2003 (San Francisco); for the 2004 Meeting (Washington, DC) I prepared a poster which I displayed along with a woman I supervised.
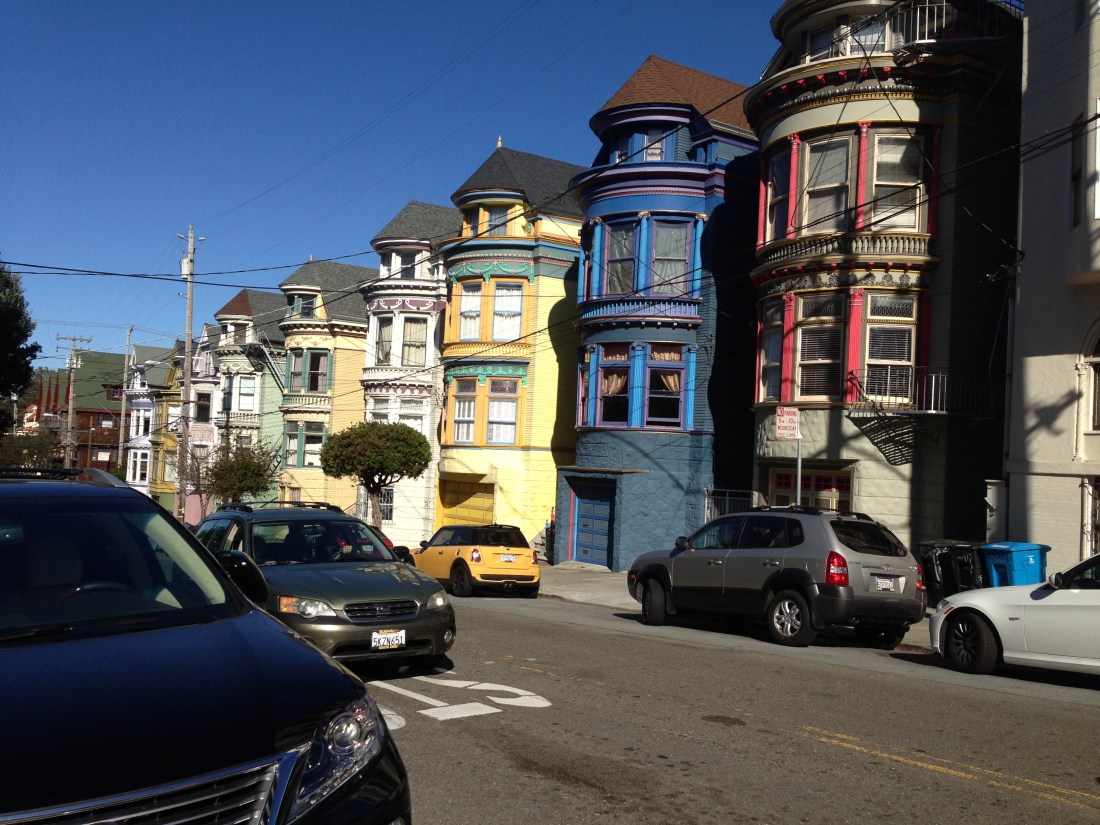
That talented young woman—now one of my closest friends—was a huge reason why the 2003 APHA Meeting in San Francisco was so memorable. Other, of course, than the fact that it was IN SAN FRANCISCO!


As much as fun as it was to wander through the exhibit halls and chat with the folks from schools of public health, research organizations, public health advocacy groups, medical device firms and so forth; to amass a full bag of free goodies (“swag,” I prefer to call it) in the process; to read and ask questions about scientific posters; and to sit in a wide range of scientific sessions…
(no, I am serious. I really used to enjoy that stuff, especially in the company (during the day and/or over dinner and drinks in the evenings) of friendly work colleagues)
…after about two days, my colleague and I had had enough.
So we literally played hooky from the Meeting one day.
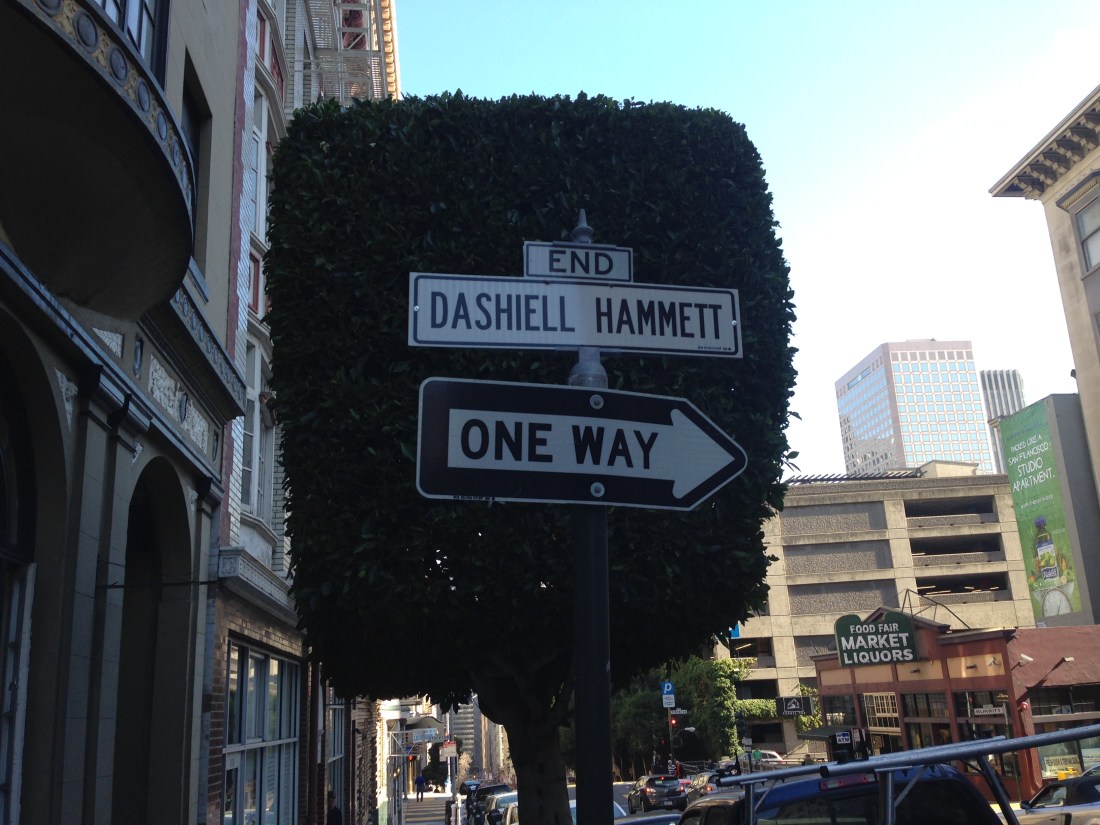
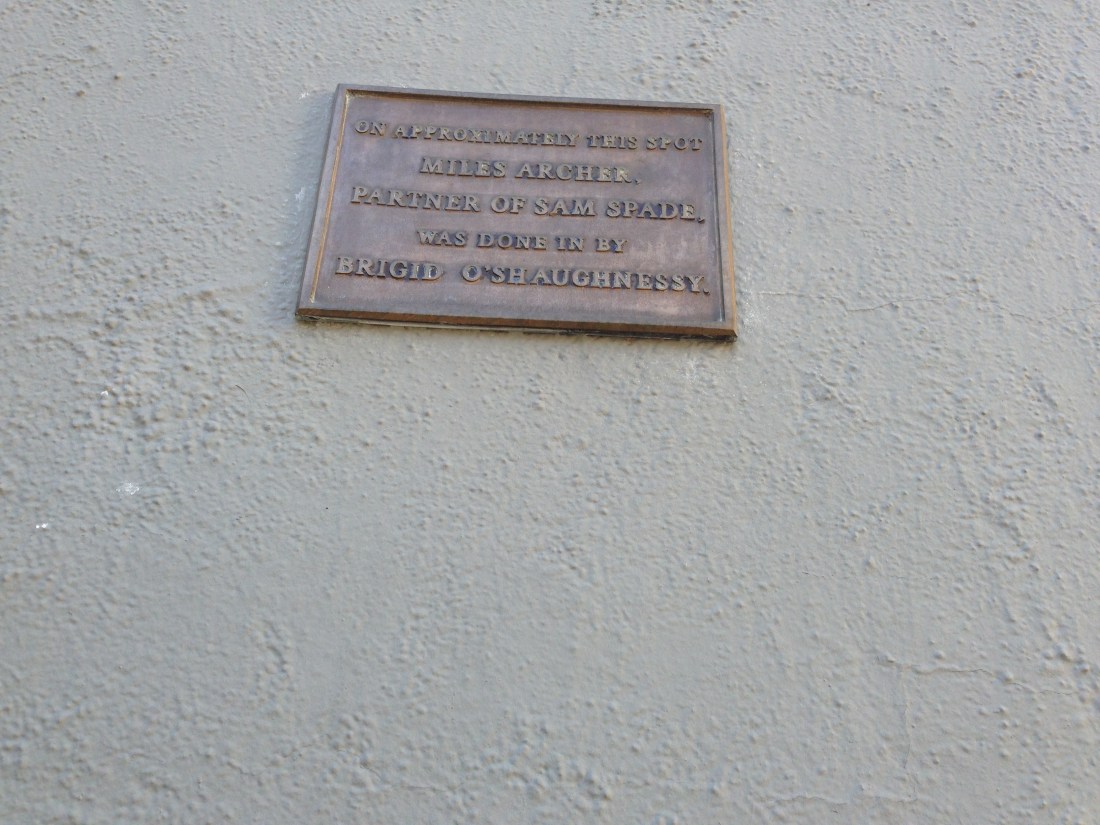
First, I dragged the poor woman on a “Dashiell Hammett” tour, which took place only a few blocks from our Union Square hotel.
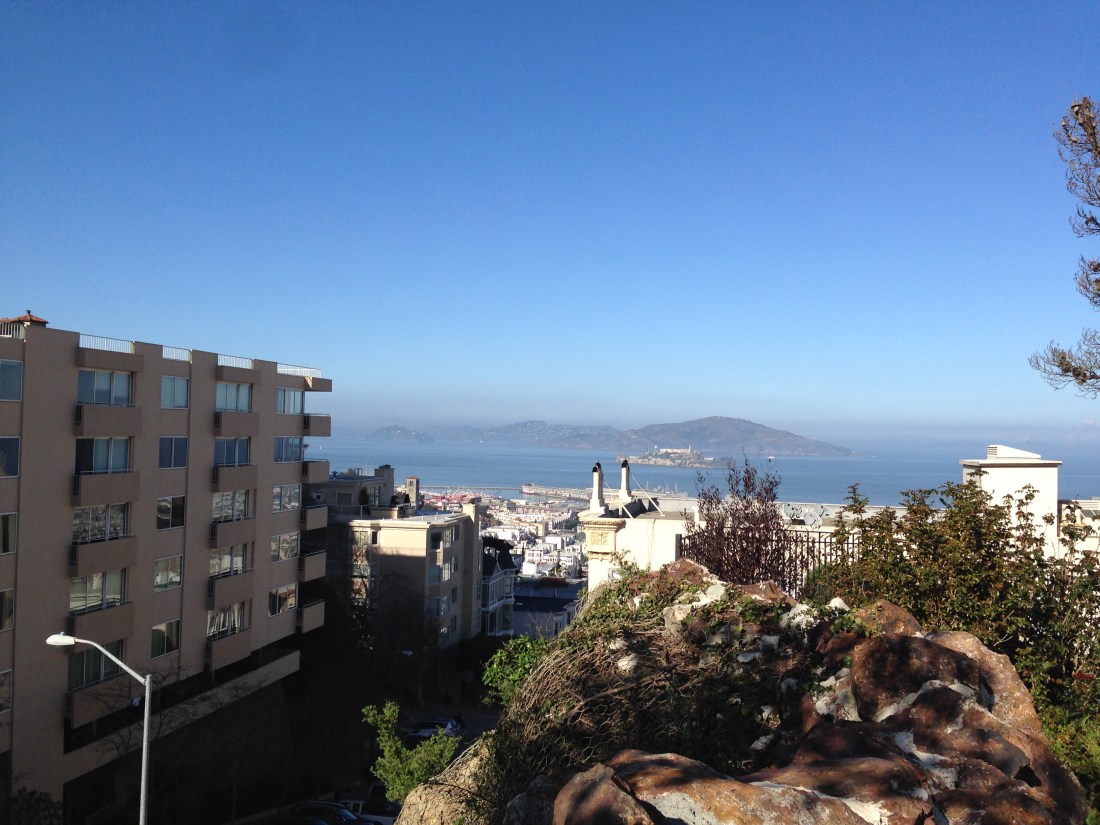
Then, we meandered through Chinatown (whose entrance was mere steps away)—stopping for bubble teas along the way—all the way to Fishermen’s Wharf.

Our ultimate destination was the ferry to Alcatraz. The Alcatraz tour may have been the highlight of that trip. That place is eerie, creepy and endlessly fascinating.
Someday I will take my wife and daughters there.
That Meeting was also the apex of my APHA experiences. After three years of them, the 2004 version in DC felt stale. I skipped the 2005 APHA Meeting in Philadelphia, as I had just returned to Boston to start my master’s program in biostatistics at Boston University, though I did briefly attend the 2006 APHA Meeting since it was in Boston, and it was a chance to see former work colleagues.
**********
Ultimately, then, attending the 2017 APHA Meeting in Atlanta was a life experiment, a way to gather qualitative “data” to assess the notion that I had put a health-related data analysis career behind for good.
I arrived in Atlanta on the evening of November 6 and took a taxi to the Marriott Marquis.
Holy moley, is this place huge…and it had those internal glass elevators which allow passengers to watch the lobby recede or approach at great speed.

It was both liberating and lonely not to have work colleagues attending with me. As great as it was not to have to report to anybody, it also meant my time was far more unstructured (other than attending the sessions in which I was presenting).
On Tuesday morning, I dressed in my “presentation” clothes and made my way to the Georgia World Congress Center. This meant taking a mile-long walk in drenching humidity carrying a fully-packed satchel because the APHA chose to reduce its carbon footprint by eliminating shuttle buses.
So I was a sweaty mess when I arrived at the heart of the action. Still, I soldiered on, registering and then checking the location of my session room (luckily, both of the my sessions were in the same room—if only because it allowed me, on Wednesday morning, to retrieve the reading glasses I had left on the podium Tuesday evening).
This place was also massive and labyrinthine. It took me a good 30 minutes just to locate the Exhibit Halls.
I wandered through them for an hour or so, talking to some interesting folks and reading a couple of posters. The swag was wholly uninspiring, I am sorry to say.
And I felt…nothing.
No pangs of regret.
No overwhelming desire to return to this field of work.
No longing for work colleagues (other than a general loneliness).
In fact, I mostly felt like a ghost, the way one sometimes does walking around an old alma mater or place you used to live.
This was my past, and I was perfectly fine with that[5].
That is not to say I did not enjoy giving my talks (which were very well received—I am usually nervous before giving oral presentations…until I open my mouth, and the performer in me takes charge). I did, very much. I also enjoyed listening to the nine other speakers with whom I shared a dais. I picked up terms like “geographic-weighted regression” I plan to explore further. I even took the opportunity to distribute dozens of my new business cards (the ones that describe me, tongue somewhat in cheek, as “Writer * Blogger * Film Noir Researcher * Data Analyst”).
But none of that altered my conviction that I have made the right career path decision. I have no idea where the writing path will ultimately lead (although the research for my book has already taken me down some unexpected and vaguely disturbing alleys), professionally or financially, but I remain glad I chose that path.
One final thing…or perspective.
Tuesday, November 7 was also the day that governor’s races were held in New Jersey and Virginia, along with a mayor’s race in New York City and a wide range of state and local elections nationwide.
I had expected to settle in for a long night of room service and MSNBC viewing, but the key races were called so early that I decided to take quick advantage of the hotel swimming pool.
Yes, I waited at least 30 minutes after eating to enter the water.
The pool at the Atlanta Marquis Marriott is primarily indoors (and includes a VERT hot hot tub, almost—but not quite—too hot for me), but a small segment of it is outside; you can swim between the two pool segments through a narrow opening.
If you look directly up from the three shallow steps descending into the outdoor segment of the pool, you see this (if you can find the 27th floor, one of those windows was my room):
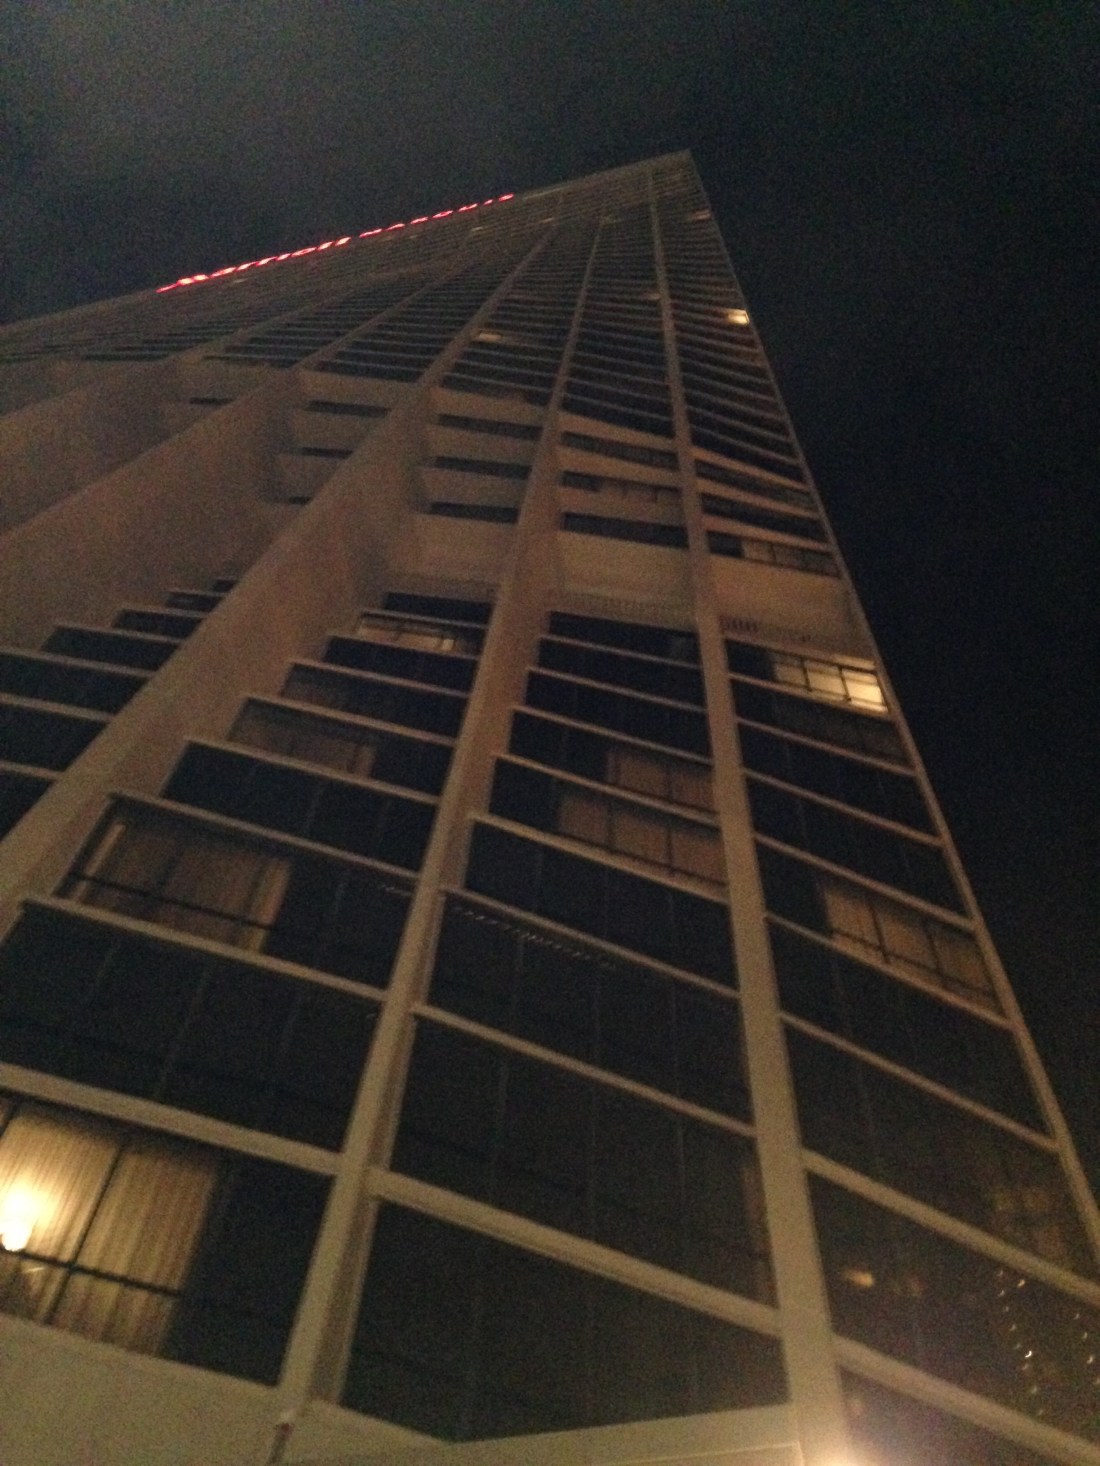
I literally carried my iPhone into the pool to take this photograph, leaning as far back as I could. Thankfully, I did not drop my iPhone in the pool.
Until next time…
[1] The coincidence is not perfect, though, as I do not think we STAYED at the Marriott Marquis in 2001.
[2] Other than the fact that I was awarded a Mellon Dissertation Completion Fellowship in 1994. It was kind of a last-ditch spur to completion. It did not work.
[3] This was the same professor who proclaimed as an aside in a graduate American politics seminar that if you really want to do something hard, get a PhD in epidemiology. Which, of course, I did…25 years later.
[4] Where the Keynote Address was delivered—passionately and to great applause—by an obscure Democratic governor of Vermont named Howard Dean, whose presidential campaign I supported from that moment.
[5] The one caveat to this blanket page-turning is my ongoing interest in the geographic determinism, which I am indulging through state- and county-level analyses of the 2016 presidential elections. This may be the one successful way to lure me back into the professional data-analytic world.


A big trip and detailed photo-essay. Thank you.
LikeLiked by 1 person
Thank you!
LikeLiked by 1 person