Almost every day, what appear first on FiveThirtyEight’s compilation of the latest polls are new polls assessing whether respondents approve or disapprove of the job Joe Biden is doing as president. As of December 14, 2023 – at least, according to the FiveThirtyEight aggregation method – 38.0% approve of the job Biden is doing as president, while 55.7% disapprove; some 6.3% of respondents are undecided. Biden’s net approval rating is thus 38.0% – 55.7% = -17.7%, which is fairly low, historically.
However, one highly-surprising pollster consistently shows much better approve/disapprove percentages than all other pollsters. Further examination shows two other pollsters with similarly “less-bad” percentages.
Are pollsters underestimating Biden’s net approval? To test this idea, I compiled all presidential approval polls conducted entirely after October 7, 2023, the day Hamas attacked Israel. Given a choice of surveyed populations, my order of preference was likely voters then registered voters then adults.
***********
Just bear with me while I explain how I calculate my weighted-adjusted polling average, or WAPA. Feel free to jump to the next section if this does not interest you.
First, I adjust approve, disapprove and net approval percentages by adding a pollster’s historic partisan bias as calculated by FiveThirtyEight.com: how much, on average, polling averages from that pollster miss final election margins. For example, YouGov conducted a poll of 1,232 registered voters from December 9-12, 2023 showing Biden with 42% approval and 55% disapproval. In recent years, YouGov has overestimated Democratic strength by 0.8 percentage points (“points”) on average. Positing that “Democratic” is a proxy for “approve of Biden,” I subtract 0.4% (half of 0.8%) from 42% and add 0.4% to 55% to create a “bias-adjusted” approve/disapprove of 41.6%/55.4%. The net approval then falls from -13.0% to -13.8%.
FiveThirtyEight shows which organization, if any, commissioned a poll. YouGov, for example, conducts weekly tracking polls for The Economist and occasional polls for CBS News and Yahoo News. A handful of organizations are clearly partisan, like the Republican America’s New Majority Project, for whom McLaughlin & Associates (“McLaughlin”) conducted a poll from November 27-30. Other organizations have a noticeable partisan lean, like right-of-center Fox News, for whom Beacon Research/Shaw & Company Research conducted a poll from November 10-13. If the commissioning organization is flagged by FiveThirtyEight as partisan, I add an additional -3.0 (Democratic) or 3.0 (Republican) to the historic bias. If it is not so flagged, but has – to me – a clear partisan lean, I add an additional -1.5 (Democratic) or 1.5 (Republican).
Next, I calculate weights for time and quality. For the former, I use the midpoint of a poll’s field dates, rounding up a day when the midpoint falls between two days. Thus, the Fox News poll’s field date midpoint is November 12, not “November 11.5.” I then calculate what percentage of days between January 1 and December 31, 2023 the midpoint is. November 12 is day 315 out of 365, and 315/365 = 0.863. This percentage is the time weight.
For the latter, meanwhile, I use the FiveThirtyEight pollster rating, converted to a number (A+=4.3, A=4.0, A-=3.7, etc.). Quality weight is percentage a pollster’s rating is of the maximum of 4.3. Thus, the B+ grade assigned to YouGov is equivalent to 3.3/4.3 = 0.767. Ratings of A/B and B/C are assigned values of 3.5 and 2.5, respectively. Pollsters not yet rated by FiveThirtyEight are assigned a letter grade of C+. In two cases, two pollsters combined to conduct a poll, so I used the average of their ratings.[1]
Multiplying time weight by quality weight yields an overall weight assigned to each bias-adjusted approve, disapprove and net approval percentage. Overall weight is cut in half if approve and disapprove percentages sum to exactly 100% (i.e., no undecideds, which is highly unusual), and if the poll was conducted on a single day; polls are traditionally conducted over multiple days so surveyors have more chances to reach randomly-selected respondents.[2]
Finally, I multiply each of the three bias-adjusted percentages by overall weight, sum the products and divide the sum by the sum of the overall weights. This yields a WAPA in which all polls are treated as statistically independent. However, because polls conducted by the same firm are not statistically independent, I also calculate bias-adjusted, time-weighted averages for each pollster. These pollster-specific averages are then weighted by pollster rating. I present the average of the two WAPA percentages – which rarely differ more than 1 point – as my “final” estimate.
***********
A total of 109 Biden approval polls were conducted during these two-plus months.[3] These polls were conducted by 44 unique pollsters. They have a mean rating of B/B- and bias of 0.1 points Democratic – albeit with a range of 3.3 points Democratic (RMG Research) to 1.6 points Republican (McLaughlin & Associates).[4] Most polls surveyed registered voters (64; 59%), with the remainder evenly split between likely voters (21; 19%) and all adults (24; 22%).
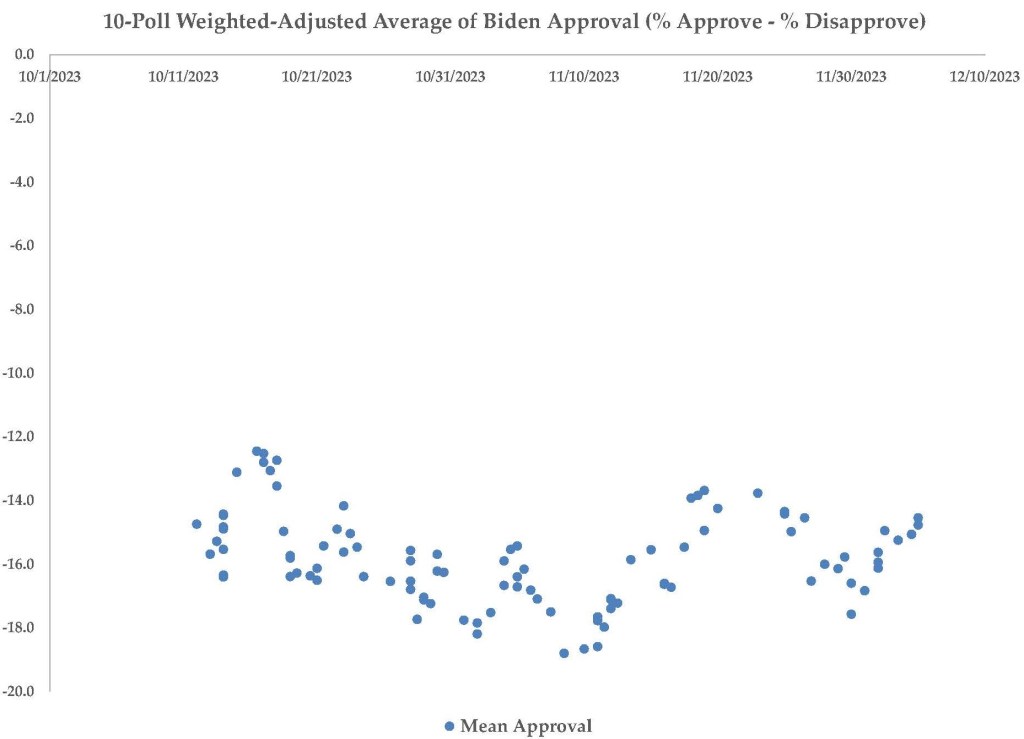
Overall, Biden has a simple average net approval of -15.8%, with a WAPA of -15.7%. Considering each pollster as a separate entity, percentages increase slightly to -16.5% each. I thus estimate 39.8% of 551,972 total persons surveyed[5] approve of Biden’s performance while 55.9% disapprove, for a net approval of -16.1%. This is 1.6 points higher than the FiveThirtyEight average. Figure 1 shows change in this value over the past two-plus months; x-axis dates are medians of the midpoint of the 10 field dates.
Figure 1:
There is a wide disparity across the 20 pollsters releasing at least 2 Biden approval polls during this period, as Table 1 shows. These pollsters account for 84 (78%) of the polls analyzed for this essay.
Table 1: Average Biden Net Approval, Oct 8 – Dec 13, 2023, Minimum 2 Polls
| Pollster | 538 Bias | 538 Rating | # Polls | Average | WAPA |
| Rasmussen Reports | R+1.4 | B | 10 | -11.2% | -8.2% |
| Emerson College | D+0.3 | A- | 3 | -10.0% | -10.4% |
| Marist College | D+0.3 | A | 3 | -9.7% | -10.4% |
| McLaughlin & Associates | R+1.6 | B/C | 5 | -15.8% | -11.9% |
| YouGov | D+0.8 | B+ | 14 | -13.7% | -14.2% |
| HarrisX | R+1.0 | B | 7 | -14.6% | -14.1% |
| NewsNation | D+0.1 | B/C | 2 | -14.0% | -14.2% |
| Big Village | D+0.2 | B- | 2 | -15.0% | -15.2% |
| Ipsos | D+1.8 | B- | 2 | -15.0% | -16.7% |
| TIPP Insights | R+0.8 | A- | 2 | -17.5% | -16.9% |
| Leger | D+0.2 | B/C | 2 | -17.0% | -17.3% |
| American Research Group | D+0.1 | C+ | 2 | -18.0% | -18.1% |
| Morning Consult | D+3.1 | B- | 9 | -15.8% | -18.9% |
| Hart Research Associates/ Public Opinion Strategies | D+0.8 | B+ | 2 | -19.0% | -19.7% |
| Navigator Research | D+0.7 | B/C | 2 | -19.5% | -20.2% |
| Quinnipiac University | D+0.6 | A- | 3 | -19.7% | -20.3% |
| AP-NORC* | n/a | C+ | 2 | -20.5% | -20.4% |
| RMG Research | D+3.3 | B- | 9 | -18.1% | -21.4% |
| Echelon Insights | R+0.2 | A/B | 2 | -22.0% | -21.7% |
| SSRS | D+2.5 | C+ | 2 | -23.0% | -25.6% |
| Average | D+0.5 | B/B- | 4.2 | -16.5% | -16.8% |
* AP-NORC is not yet rated by FiveThirtyEight.com
These 20 pollsters, who have a higher pro-Democratic bias (D+0.5) than the 24 single-poll pollsters (R+0.1), show average Biden approval ranging between -23.0% (SSRS) to -9.7% (Marist) using a simple average, and between -25.6% (SSRS) and -8.2% (Rasmussen Reports) using WAPA.
To their credit, results from 27 polls were released for multiple survey populations. Thus, in the 25 cases in which a pollster assessed registered voters (or, in a Selzer & Co. poll conducted October 10-15, likely voters) and adults, the former had an unweighted average of 40.9% approve and 55.9% disapprove, while the latter had 38.8% approve and 55.6% disapprove. Biden’s net approval was thus 1.8 points higher among registered voters than among adults. Biden also had a 1.6-point higher net approval among likely voters (41.3% approve, 56.7% disapprove) in three polls comparing them to either registered voters or all adults (39.7%, 56.7%). The Selzer & Co. poll is included in both comparisons.
In fact, when only the 21 polls of likely voters are examined, Biden’s mean approval (using WAPA) is 43.1%, with 54.7% disapproving. This compares to approve/disapprove values of 39.5%/56.4% in polls of registered voters and 37.9%/55.5% in polls of adults. Net approval is -11.6%, -16.9% and -17.6%, respectively. Not only is Biden’s approval noticeably higher among likely voters (however assessed a year before the election), mean percentage undecided rises from 2.2% among likely voters to 4.1% among registered voters to 6.7% among all adults. Likely voters tend to pay the most attention to current events, so it is telling they approve more of Biden, relatively speaking.
There is a catch, though: while the pollster quality differs little across respondent groups (B-/B; B/B- and B-, respectively), pollsters of likely voters have a mean bias of 1.1 points Republican, compared to 0.4 points more Democratic (registered voters) and 0.6 points more Democratic (adults).
That is, the pollsters that most overestimate Republican margins are also the ones polling likely voters (who historically lean a bit more Republican) – and finding the highest approval numbers for Biden. There is a moderately-strong positive association between bias and simple average net approval (r=+0.30). I note without comment that 19 of the 109 polls analyzed here were adjusted an additional 1.5 or 3.0 points because they were conducted for a Republican-leaning organization while only one poll received an additional -3.0 points for being conducted for a Democratic-leaning organization.[6]
And the pollster that first caught my eye? The notorious Rasmussen Reports (“Rasmussen”), former president Trump’s favorite pollster, who consistently sample 1,500 likely voters. Their recent bias is 1.4 points more Republicans, on average; my own analysis shows they overestimated the Republican margin in the national vote for Congress in 2022 by an average of 2.4 points. The 10 Biden approval polls released by Rasmussen since October 8 – which employ a combination of interactive voice response (i.e., automated telephone) and online surveys – show an unweighted average of 43.6% approve and 54.8% disapprove, for a net approval of -11.2%. Adjusted for partisan bias and time, these values improve to 45.1%/53.3%, for a somewhat more respectable net approval of -8.2%.
Overall, the three pollsters with a Republican bias of at least 1.0% – McLaughlin, Rasmussen and Harris X – show an average Biden net approval of -13.9% (simple) and -11.4% (WAPA). By contrast, the three pollsters with a Democratic bias of at least 2.5% – RMG Research, Morning Consult and SSRS – have corresponding values of -19.0% and -22.0%! In other words, Biden’s net approval is between 5.1 (simple average) and 10.6 points (WAPA) higher in the most Republican-leaning polls than in the most Democratic-leaning polls. This is, to say the least, a very counterintuitive finding.
At the same time, two other high-quality pollsters show similar, somewhat-better approval numbers for Biden; this matches the +0.33 correlation between simple average net approval and numeric pollster rating. One of these pollsters is Marist College (A; D+0.3), which conducted three polls during this period – two of registered voters and one of adults – showing Biden with an average net approval of about -10.0%.
The other is Emerson College (A-; D+0.3). In the 2022 midterms, when they conducted a combined 65 generic ballot, gubernatorial and senate election polls, they were the most accurate pollster, missing the final margin in these races by an average 0.3 points in favor of Democrats; this is based on my own analysis, but it aligns nicely with FiveThirtyEight’s assessment. They were similarly accurate in 2020.
So, when I see three Emerson College polls conducted between October 8 and December 13, 2023 showing a simple average of 40.3% approve and 50.3% disapprove, for a net Biden approval of -10.0%, I pay close attention. Looking at WAPA changes this only slightly to 40.1% approve/50.5% disapprove. In both cases, fully 9.4% of survey respondents –registered voters – are undecided, more than twice as the overall average.
Which brings us to Quinnipiac University (A-; D+0.6). In 2022, they overestimated Democratic gubernatorial and senatorial margins by an average of 5.3 points. In 2020, they overestimated Biden’s state-level margins by an average of 6.8 points. Thus, in recent elections, they have overestimated Democratic margins by around six points. And yet…the three presidential approval polls they conducted during this period show Biden with a net approval of about -20.0%, about four points worse than the overall value!
Finally, the other two pollsters with some form of “A” rating who conducted multiple presidential approval polls during this period – TIPP Insights (A-) and Echelon Insights (A/B) – have slight Republican leans: 0.8 and 0.2 points, respectively. Averaging the two polls each conducted yields Biden net approval of around -17.0% and -22.0%, respectively. Curiously, the former polls adults, while the latter polls likely voters, contradicting the pattern of Biden having higher net approval in higher-quality polls.
***********
To summarize, Biden’s net approval is noticeably higher (though still underwater) in the most Republican polls (-11.4%, using WAPA), which overlap significantly with polls of likely voters (-11.6%). Biden’s net approval is likewise lower in the most Democratic polls (-22.0%), which overlap, albeit less so, with polls of adults (-17.6%). Put another way, Biden’s approval improves with increased Republican bias, pollster quality and the more “actual electorate” the surveyed population is.
So, what is going on here?
Let me first observe that even in the best-case scenario Biden still has a net disapproval in the high single digits.
Beyond that, a reasonable explanation is that pollsters are weighting their samples to mitigate historic partisan biases. This is a good thing, as pollsters want their sampled population to reflect the targeted population as accurately as possible. Morning Consult, Quinnipiac University, TIPP Insights and Echelon Insights all missed final margins in 2022 by at least 4.9 points too Democratic, and they now show some of Biden’s lowest net approval percentages. And both McLaughlin and Rasmussen overestimated 2022 margins by a few points too Republican, yet give Biden some of his best net approval percentages.
Except, polls from the highly-rated and remarkably-accurate-of-late Emerson College closely match both Rasmussen and the A-rated Marist College polls in giving Biden his best approval percentages. Plus, this would be an astonishing level of overcompensation on the part of these pollsters. It is at least plausible that Republican-leaning pollsters like Rasmussen and McLaughlin are simply closer to the truth, while many other pollsters have wildly overcompensated for previous – and much larger – Democratic overestimates. This overcompensation then gets compounded by adjusting these polls toward even lower Biden net approval based on their recent partisan bias.
There is also a possibility folks who are upset with Biden for various reasons – both from the left (e.g., his handling of the situation in Gaza) and the right (too many reasons to list) – are far more likely to respond a poll than folks who are more content, or at least neutral, with the Biden Administration. Such self-selection bias cannot be remedied through demographic weighting. And here I note the high undecided percentages in Emerson College polls. IF this idea is right – folks are far more vocal in their disapproval of Biden’s performance – then pushed undecideds would likely increase Biden’s approve percentages in these polls.
At any rate, while I urge you to draw your own conclusions from these data, my personal conclusion, based on the closeness between Rasmussen and Emerson College polling, is that Biden’s net approval is far closer to -10% than -20%, but perceptions of his performance are being influenced by screaming headlines about his worst polling, with no mitigation from better polls from Biden. This is y poor journalism because, for reasons too numerous to list, polls are not news.
Until next time…and if you like what you read on this website, please consider making a donation. Thank you.
[1] Fabrizio, Lee & Associates (A/B) and GBAO (B/C) conducted a poll from November 29 to December 4, as did Global Strategy Group and North Star Opinion Research (both B/C) from November 2 -7.
[2] If these were election polls, I would also assign a weight of 0.5 to surveys of adults. Also, FiveThirtyEight assigns more weight to polls with higher sample sizes, but I do not because sample size is related to estimate precision not estimate quality. Another reason is that while most polls survey between 1,000 and 2,000 people, Morning Consult surveys 45,000 adults each week. Their polls would absolutely dominate the analysis if I weighted by sample size.
[3] Rasmussen Reports conducts a daily tracking poll, covering a one-week period, but I only use polls covering non-overlapping weeks.
[4] The analytic maximum is 4.6 points pro-Republican for three McLaughlin & Associates polls.
[5] Of whom 405,000 (73%) come from just nine Morning Consult polls – meaning the other 100 polls average 1,470 respondents.
[6] Civiqs poll conducted for Daily Kos October 28-31. By contrast, 10 of the 15 public polls of the 2023 Kentucky governor’s race were flagged by me as partisan: five in favor of Democrats and five in favor of Republicans.


One thought on “Something Is Fishy With Recent Biden Approval Polls”