[This essay was updated on February 6, 2023. The number of films watched multiple times is now 718. I plan to update regularly.]
In February 2019, I posed a deceptively simple question:
What makes a pleasure “guilty?”
To answer this question, I focused on films, specifically those I had seen multiple times. I gathered publicly-available data on these movies in order to assess how these films were regarded by both critics and fans. At that time, there were 557 such films, though I excluded 23 Charlie Chan films, having discussed them in a previous post. With these data, I generated a “perceived quality” (“PQ”) score. By comparing how much I liked a film to its PQ, I compiled a list of 11 “guilty pleasure” films, those I love despite their relatively poor reputations.
Recently, I updated that list, both adding films I forgot to include the first time and watching others for a second time. I also updated all data from the Internet Movie Database (“IMDb”) and the online movie rating site Rotten Tomatoes (“RT”), learning the latter no longer provides a count of the number of RT users – as opposed to “critics” – choosing to rate a film. Instead, they provide a characterization such as “10,000+ ratings;” I removed it from the database.
The goal was less to reexamine guilty pleasures – that list barely changed – than it was to examine the process itself.
**********
Table 1 summarizes 10 of the remaining 13 variables, excluding title, category (described below) and date first shown in the United States. “Maltin” is the number of stars (BOMB=0) assigned in the 2003 or 2008 Leonard Maltin’s Movie and Video Guide.[1]
Table 1: Summary statistics for Film Ratings Measures
| Measure | N | Mean (SD*) | Median | Minimum | Maximum |
| Year of Release | 718 | 1974.1 (22.9) | 1982 | 1920 | 2020 |
| Length (mins.) | 718 | 102.8 (20.2) | 101.0 | 48 | 220 |
| IMDb Score | 718 | 7.1 (0.7) | 7.1 | 4.2 | 9.2 |
| IMDb Raters | 718 | 115,344 (256,927) | 24,115 | 169 | 2,359,960 |
| Tomatometer | 649 | 77.3 (21.5) | 84 | 0 | 100 |
| RT Critic Average | 649 | 7.0 (1.3) | 7.2 | 2.1 | 9.8 |
| RT Critics | 718 | 53.2 (66.3) | 34 | 0 | 541 |
| RT Audience Score | 713 | 72.3 (17.3) | 77 | 17 | 98 |
| RT Audience Average | 713 | 3.8 (0.4) | 3.8 | 2.3 | 4.8 |
| Maltin Stars | 681 | 2.8 (0.7) | 3 | 0 | 4 |
*SD=standard deviation, a measure of how tightly packed values are around the mean: the smaller the value, the tighter the packing. In a normal distribution, 68% of values are within 1 SD, 95% are within 2 SD and 99% are within 3 SD.
Compared to the original 557 films, this set of 718 films:
- Had identical mean and median release years – though maximum now 2020 (Tenet) and SD increased 2.0.
- Were 0.6 minutes shorter, with minimum now 48 minutes (Sherlock Jr.), increasing SD 2.4.
- Had identical mean IMDb score – a weighted average of user 0-10 ratings – while range increased slightly, 4.2 (The Adventures of Rocky & Bullwinkle) to 9.2 (The Godfather), and median dropped 0.1.
- Saw a mean increase of ~35,000 IMDb raters, with median increase of ~5,000; SD increased ~73,000, echoing a wider range of 169 (Southside 1-1000) to 2,359,960 (The Dark Knight), reflecting passage of time and addition of recent films with >1 million IMDb raters: Shutter Island, The Prestige, The Avengers, The Godfather, Interstellar and Inception.
- Saw average Tomatometer – percentage of RT critics deeming a film “fresh” – increase 0.2, though SD dropped 0.9 and median dropped 1; range is still 0 (Once Upon a Crime…) to 100 (n=47).
- Saw average and median RT critic rating – 0-10 scale – increase 0.1, while SD dropped 0.1 and range widened: 2.1 (Hexed) to 9.8 (Sherlock Jr.).
- Saw average, median and SD of number of RT critics increase by 13.2, 0 and 23.7, respectively, reflecting widened range of 0 (n=3) to 541 (Avengers: Endgame)
- Saw average and median for RT Audience Score – Tomatometer for fans – increase by 0.4 and 1, respectively, while SD dropped 0.4 while range increased slightly: 17 (Street of Chance) to 98 (The Godfather).
- Saw average and median Audience Rating – 0-5 scale – increase by 0.3: the distribution simply shifted to the right, with identical SD and new range of 2.3 (Rocky & Bullwinkle, The Opposite Sex and How to Live With Them) to 4.8 (The Godfather).
- Brought no change to Maltin statistics – though BOMB films increased from four to five with addition of Yellowbeard.
- Basically, while the films I added were slightly older and shorter on average, and raters increased with time, the distribution of ratings did not materially change with the addition of 157 movies and updated data – except RT Audience Ratings, which increased for most movies.
Put another way, the “median” film I have seen multiple times remains a good-but-not-spectacular film like the 1990 teen drama Pump Up the Volume which is 102 minutes long, has an IMDb score of 7.2 from just under 27,000 rates, a Tomatometer of 81 with an average 6.7 rating from 36 critics, a RT Audience Score of 84 with an average 4.1 rating, and 2.5 stars from Maltin. Roughly speaking, half of the films I have seen multiple times are better-rated overall than Pump Up the Volume and half are worse-rated.
But here we run into the problem I sidestepped in the original post – how to create a single quality measure for all 718 films, when I only have complete data for 613 (85.9%) of them, a decrease of 6.6 percentage points. The biggest problem is lack of Tomatometer and RT Critic Rating data for 68 films with fewer than five critics.
**********
Missing data is perhaps the bête noire of data analysts. There are only two solutions: 1) only use cases with complete data or 2) use statistical methods to estimate missing cases. The first solution is reasonable if you are not trying to generate a single value for every case and/or data are missing at random. Clearly this solution will not work here. Not only do we want a single value for each film – and only using the five variables (year, runtime, IMDb score, number IMDb raters, number RT critics) with no missing data feels inadequate – there is a clear pattern to the missing data. For example, 25 of the 37 films lacking Matlin stars were released after 2008. Conversely, the seven films lacking RT audience data were released between 1936 and 1952, while the 68 films missing RT critic data have average release year and runtime of 1948 and 81.2 minutes, respectively, with all but five released between 1931 and 1959.
This leaves estimation. A straightforward way is to use ordinary least squares regression (“OLS”), analogous to Y = Slope*X + “Where line crosses Y-axis”, or y = m*x + b, the formula we learned when first plotting data points. OLS regression similarly estimates how a dependent variable – say, RT Audience Score – is related to one or more independent variables – say, the five film measures with complete data.
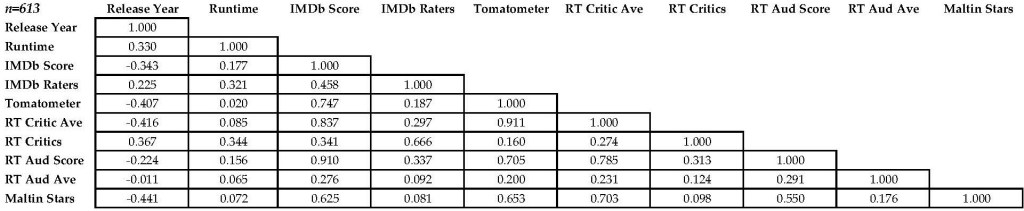
Before we begin, however, let us set a baseline to see how well the estimation process worked: the correlation matrix derived from the 561 films with complete data. I characterize these correlations in the previous post, so I do not belabor them here.
Figure 1: Film Quality Measures Correlations Matrix (n=613)
Missing data estimation is an iterative process. I progressed from variables with the fewest missing cases (7 each for RT Audience Score and Average) to those with the most missing cases (68 for Tomatometer, RT Critic Average). Consecutive OLS regressions are summarized in Table 2; Intercooled Stata 9.2 (“Stata”)[2] was used for all analyses. Because Maltin Stars is an ordinal variable – it has seven discrete categories, rather than being continuous – I considered using ordinal logistic regression, but the OLS model proved a better fit.
Table 2: Iterative Film Quality Measure OLS Regressions
| Variable | RT Aud Score | RT Aud Ave | Maltin Stars | RT Critic Ave | Tomatometer |
| Constant | -516.323 | 1.189 | 12.415 | 16.800 | -90.470 |
| Year of Release | 0.209 | 0.00031 | -0.0073 | -0.0085 | 0.050 |
| Length (mins.) | 0.0028 | 0.00075 | 0.0038 | -0.0024 | -0.033 |
| IMDb Score | 24.864 | 0.017 | 0.481 | 0.668 | 2.059 |
| IMDb Raters | -0.000016 | 8.84e-8 | -7.84e-7 | -2.52e-8 | -3.6e-6 |
| RT Critic Average | 15.064 | ||||
| RT Critics | -0.0045 | -0.00029 | 0.0021 | 0.0018 | -0.020 |
| RT Audience Score | 0.022 | -0.0037 | 0.027 | 0.462 | |
| RT Audience Average | 0.310 | -0.282 | -21.710 | ||
| Maltin Stars | 0.504 | 0.874 | |||
| Number of cases | 707 | 707 | 677 | 645 | 645 |
| Adjusted R-squared | 0.805 | 0.924 | 0.459 | 0.769 | 0.850 |
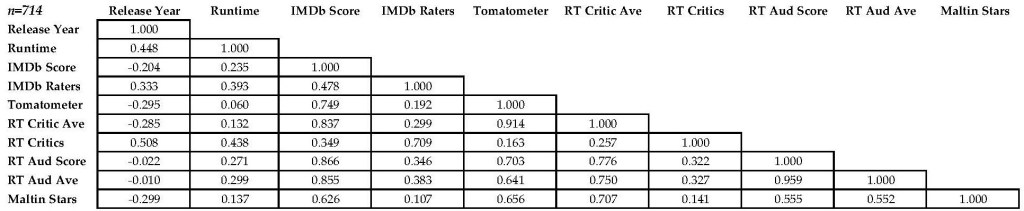
These are solid models, accounting for between 45.9 (Maltin Stars) and 92.4% (RT Audience Average) of a dependent variable’s variance. Moreover, the estimated values had high face validity – they made “sense” in the context of other values. And as Figure 2 shows, the 189 estimated cases did not substantively change (most of) the relationships between these variables; overall, correlations increased by an average of just 0.111.
Figure 2: Film Quality Measures Correlations Matrix (n=718)
**********
Armed with complete data, I used factor analysis[3] to calculate a single “film quality” score. The results were nearly identical to those from the previous post: using all 10 variables yields two factors accounting for 67.7% (PQ) and 26.7% (Public Awareness) of the total variance, while removing year of release, runtime and numbers of raters yields one factor (PQ) accounting for an astonishing 92.4% of the total variance: IMDb users, RT critics, RT fans and Maltin rate movies in remarkably similar ways. Table 3 presents the factor loadings (correlations with underlying dimension being assessed) and score coefficients used to generate a single PQ score.
Table 3: Factor Analysis of Film Quality Measures, Two Iterations
| Variable | All 10 Variables 67.8% | “Rating” Variables Only 92.5% | ||
| Loadings | Coefficients | Loadings | Coefficients | |
| Year of Release | -0.097 | 0.023 | ||
| Length (mins.) | 0.287 | 0.022 | ||
| IMDb Score | 0.935 | 0.230 | 0.913 | 0.108 |
| IMDb Raters | 0.460 | 0.043 | ||
| Tomatometer | 0.824 | 0.091 | 0.859 | 0.134 |
| RT Critic Average | 0.911 | 0.306 | 0.931 | 0.343 |
| RT Critics | 0.414 | 0.063 | ||
| RT Audience Score | 0.919 | 0.185 | 0.922 | 0.250 |
| RT Audience Average | 0.906 | 0.181 | 0.902 | 0.207 |
| Maltin Stars | 0.669 | 0.037 | 0.688 | 0.037 |
From these coefficients, Stata[4] calculated two PQ scores – PQAll and PQRating – for each film. Think of these values as SD above or below Pump Up the Volume. They are correlated a whopping 0.994, though they do have subtle differences, as Table 4 reveals:
Table 4: 30 Highest Rated Films I Have Seen Multiple Times, Compared by PQ Score
| PQAll | PQScore |
| 30. No Country For Old Men | 30. L. A. Confidential |
| 29. The Wizard of Oz | 29. The Cabinet of Dr. Caligari |
| 28. Memento | 28. The Apartment |
| 27. The Third Man | 27. Vertigo |
| 26. Double Indemnity | 26. Annie Hall |
| 25. M (1931) | 25. Back to the Future |
| 24. On the Waterfront | 24. The General |
| 23. L. A. Confidential | 23. Kind Hearts and Coronets |
| 22. Metropolis | 22. The Wizard of Oz |
| 21. North By Northwest | 21. Metropolis |
| 20. The Avengers | 20. Some Like It Hot |
| 19. Chinatown | 19. North By Northwest |
| 18. Up | 18. Star Wars Episode IV: A New Hope |
| 17. Dr. Strangelove, or How I Learned to Stop Worryiing and Love the Bomb | 17. Double Indemnity |
| 16. Sunset Boulevard | 16. Chinatown |
| 15. Rear Window | 15. Dr. Strangelove, or How I Learned to Stop Worryiing and Love the Bomb |
| 14. Back to the Future | 14. The Third Man |
| 13. Citizen Kane | 13. On the Waterfront |
| 12. It’s a Wonderful Life | 12. Rear Window |
| 11. Psycho | 11. It’s a Wonderful Life |
| 10. The Departed | 10. M (1931) |
| 9. Indiana Jones and the Raiders of the Lost Ark* | 9. Psycho |
| 8. Casablanca* | 8. Citizen Kane |
| 7. Star Wars Episode IV: A New Hope | 7. Indiana Jones and the Raiders of the Lost Ark* |
| 6. 12 Angry Men* | 6. Sunset Boulevard |
| 5. Inception | 5. Sherlock Jr. |
| 4. Avengers: Endgame | 4. Pulp Fiction* |
| 3. Pulp Fiction* | 3. Casablanca* |
| 2. The Dark Knight | 2. 12 Angry Men* |
| 1. The Godfather* | 1. The Godfather* |
Twenty-two films appear on both lists, including my favorite film, L.A. Confidential; Vertigo is essentially tied for #30 by PQAll. Not surprisingly, the eight PQAll-only films have a median release year of 2008.5, while the eight PQScore-only films have a median release year of 1944.0. Only five films appear in the top 10 for both scores, with – again – two older films (It’s A Wonderful Life, Rear Window) being replace by two relatively newer films (Indiana Jones and the Raiders of the Lost Ark, Pulp Fiction).
While this is a very impressive list of films – I was even more blown away by 12 Angry Men the second time – it is based ONLY on films I have seen multiple times. It excludes highly-regarded films (per the 20 top-ranked films on IMDb) I have only seen once: The Shawshank Redemption, The Godfather: Part II, Fight Club, Forrest Gump, Star Wars Episode V: The Empire Strikes Back, The Matrix, Goodfellas, One Flew Over the Cuckoo’s Nest and Se7en. And then there are movies I have not seen at all: Schindler’s List; the Lord of the Rings trilogy; The Good, the Bad and the Ugly; and Seven Samurai.
This reflects my personal taste in movies: older, noir-tinged, mysteries and comedies rather than more contemporary fantasy, war-based or western films; whereas the median year of release of the top 250 films by PQScore is 1971.5, respectively, that of the 250 films by IMDb score is 1994 – with 51 being released in 2011 or later, a strong indication of recency bias in the IMDb score data.
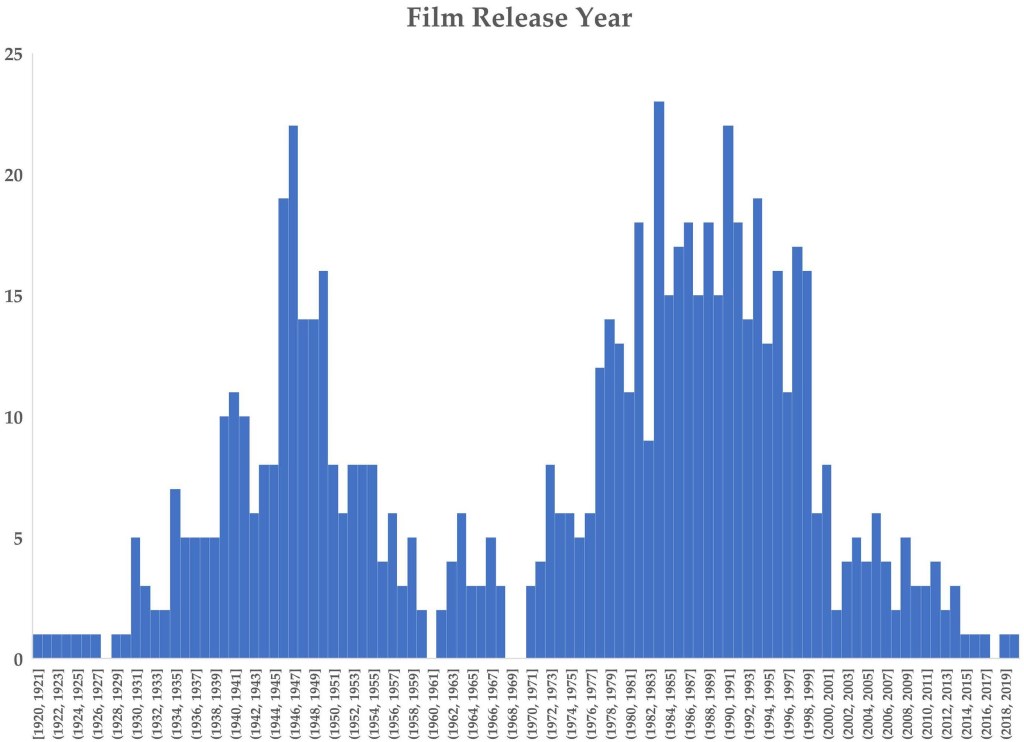
Another way to consider my particular taste in movies is to examine the distribution of year of release (Figure 3). There are two distinct peaks: 1946-50 (n=85, 11.9%) and 1982-99 (n=294, 41.0%). The former period roughly corresponds to the pinnacle of classic film noir, while the latter is my primary first-run-movie-watching period – ages 15 to 33. Indeed, 136 (18.9%) of these films are classic-era films noir (i.e. 10.0 or more POINTS), released between 1940 (Stranger on the Third Floor) and 1958 (Touch of Evil) with average PQAll and PQScore of -0.02 and 0.04, respectively (relative to 0, overall). This excludes 18 films directed by Alfred Hitchcock, 10 of which are widely considered film noir, with average PQAll and PQScore of 0.89 and 0.94, respectively. It also does not include films with at least 10.0 POINTS released before 1940, M (1.59, 1.67) and Scarface (0.97, 1.10), and the 32 I films I classify as Neo-Noir – those released after 1960 with at least 7.0 POINTS; the latter films have average PQAll and PQScore of 0.62 and 0.54, respectively. Finally, there are 58 films released before 1960 – not film noir or Hitchcock, not Charlie Chan (n=23; -0.71, -0.68), and not starring The Marx Brothers (n=9; 0.34, 0.47) – with averages of 0.70 and 0.79, respectively. The other 418 films (58.2%) – excluding the 25 directed by Woody Allen[5] (n=25; 0.23, 0.28) – have averages of -0.16 and -0.19, respectively. These values are broadly similar to those from the original essay, excepting the addition of “Charlie Chan” and “Neo-Noir.”
Figure 3: Distribution of Year of Release is Bimodal
Even more instructive is to compare my favorite film by time period (minimum 5 films) to the film with the highest PQAll and PQScore from that period. I also include my personal ranking. Boldfaced films are in my personal top 10.
1920 to 1930
Number films = 9
Average PQAll = 1.08
Average PQScore = 1.20
Top film: Sherlock, Jr. (#110; 1.51, 1.72)
Personal favorite: The Phantom of the Opera (#22; 0.71, 0.84)
Comment: Three of my 100 favorite films were released between 1920 and 1930.
1931
Number films = 5
Average PQAll = 0.61
Average PQScore = 0.74
Top film: M (#154; 1.59, 1.67)
Personal favorite: Monkey Business (#36; 0.54, 0.71)
Comment: I have seen at least five other films released in 1931, making it a key year in my personal fandom
1932 to 1934
Number films = 7
Average PQAll = 0.68
Average PQScore = 0.82
Top films: The Thin Man (#52; 1.28,1.44) and Duck Soup (#326; 1.23, 1.40)
Personal favorite: The Thin Man
1935
Number films = 7
Average PQAll = 0.22
Average PQScore = 0.33
Top film: A Night at the Opera (#13; 1.19, 1.30)
Personal favorite: A Night at the Opera
1936
Number films = 5
Average PQAll = -0.09
Average PQScore = -0.04
Top film: My Man Godfrey (#433; 1.11, 1.22)
Personal favorite: After the Thin Man (#80; 0.80, 0.94)
Comment: Three Charlie Chan films pull down the score.
1937
Number films = 5
Average PQAll = -0.27
Average PQScore = -0.21
Top film: A Day at the Races (#153; 0.61, 0.74)
Personal favorite: Charlie Chan on Broadway (#28; -0.91, -0.95),
Comment: Three Charlie Chan films pull down the score.
1938
Number films = 5
Average PQAll = -0.26
Average PQScore = -0.23
Top film: Bringing Up Baby (#132; 1.17, 1.28)
Personal favorite: Bringing Up Baby
Comment: Two Charlie Chan films pull down the score.
1939
Number films = 5
Average PQAll = -0.27
Average PQScore = -0.26
Top film: The Wizard of Oz (#509; 1.54, 1.52)
Personal favorites: Tie: Charlie Chan at Treasure Island (#17; 0.08, -0.16), Charlie Chan in Reno (#17; -0.41, -0.66)
Comment: Nothing against Wizard – I just burned out on it decades ago.
1940
Number films = 10
Average PQAll = 0.14
Average PQScore = 0.23
Top film: Rebecca (#31; 1.52, 1.42)
Personal favorite: Foreign Correspondent (#10; 0.62, 0.71)
Comment: Five of my 100 favorite films were released in 1940, with Stranger on the Third Floor (#104) just missing. And welcome to Hollywood, Alfred Hitchcock.
1941
Number films = 11
Average PQAll = 0.15
Average PQScore = 0.22
Top film: Citizen Kane (#304; 1.74, 1.68)
Personal favorite: The Maltese Falcon (#3; 1.35, 1.44)
Comment: Film noir bursts on the scene with a bang – four of the top 100 films by score were released this year.
1942
Number films = 9
Average PQAll = 0.03
Average PQScore = 0.09
Top film: Casablanca (#249; 1.87, 1.79)
Personal favorite: All Through the Night (#59; 0.10, 0.24)
Comment: Humphrey Bogart starring in three top films in two years.
1943
Number films = 6
Average PQAll = 0.07
Average PQScore = 0.23
Top film: Shadow of a Doubt (#429; 1.21, 1.34)
Personal favorite: Tie: I Walked With a Zombie (#170; 0.22, 0.38) and The Seventh Victim (#170; -0.21, -0.04)
Comment: Val Lewton riding high at RKO Radio Pictures.
1944
Number films = 8
Average PQAll = 0.70
Average PQScore = 0.79
Top film: Double Indemnity (#26; 1.58, 1.60)
Personal favorite: Laura (#6; 1.42, 1.32)
Comment: 1944 is the best year for film quality since 1931, primairly because the Fox Charlie Chan era ended. Four of my 100 favorite films were released this year.
1945
Number films = 8
Average PQAll = -0.12
Average PQScore = -0.06
Top film: The Lost Weekend (#326; 1.05, 1.11)
Personal favorite: Fallen Angel (#62; -0.30, -0.25)
Comment: I have only seen Mildred Pierce once.
1946
Number films = 19
Average PQAll = -0.04
Average PQScore = 0.02
Top film = It’s A Wonderful Life (#678; 1.77, 1.67)
Personal favorite: Deadline at Dawn (#34; -0.60, -0.52)
Comment: This is the second large disconnect between the “best” film released in a year and my favorite film from that year. I also burned out on Wonderful Life decades ago.
1947
Number films = 22
Average PQAll = -0.22
Average PQScore = -0.15
Top film: Out of the Past (#20; 1.25, 1.37)
Personal favorite: Out of the Past
Comment: This is the first year in which at least 20 films I have seen multiple times were released.
1948
Number films = 14
Average PQAll = 0.14
Average PQScore = 0.24
Top film: Rope (#103; 0.88, 0.94)
Personal favorite: Call Northside 777 (#25; 0.05, 0.07)
Comment: Seven of my top 103 films were released this year. At some point, I will rewatch The Treasure of the Sierra Madre.
1949
Number films = 14
Average PQAll = 0.10
Average PQScore = 0.18
Top film = The Third Man (#232; 1.56, 1.63)
Personal favorite: Impact (#33; -0.63, -0.67)
Comment: Despite the seeming disconnect, Kind Hearts and Coronets (#72; 1.38, 1.51) ranks second both ways.
1950
Number films = 16
Average PQAll = -0.09
Average PQScore = -0.03
Top film: Sunset Boulevard (#666; 1.69, 1.70)
Personal favorite: The Asphalt Jungle (#55; 0.92, 1.00)
Comment: Billy Wilder and John Huston return with a vengeance.
1951
Number films = 8
Average PQAll = 0.17
Average PQScore = 0.27
Top film: Strangers on a Train (#112; 1.24, 1.32)
Personal favorite: His Kind of Woman (#69; -0.08 -0.01)
1952
Number films = 6
Average PQAll = -0.09
Average PQScore = -0.03
Top film: The Narrow Margin (#164; 0.68, 0.84) and The Bad and the Beautiful (#400; 0.73, 0.74)
Personal favorite: Kansas City Confidential (#151; 0.07, -0.04)
Comment: This is the first time the best film I have seen multiple times released one year is clearly not the best film released that year. That honor goes to Singin’ in the Rain, which I have yet to see in its entirety.
1953
Number films = 8
Average PQAll = -0.16
Average PQScore = -0.10
Top film: The Big Heat (#505; 1.01, 1.12)
Personal favorite: 99 River Street (#54; 0.31, 0.46)
1954
Number films = 8
Average PQAll = 0.13
Average PQScore = 0.14
Top film: Rear Window (#56; 1.72, 1.65), edging out On the Waterfront (#150; 1.59, 1.63)
Personal favorite: Dial M For Murder (#23; 0.86, 0.83),
Comment: I have yet to see Seven Samurai…and Hitchcock is hitting his absolute peak, thanks to Philadelphia’s Grace Kelly.
1955
Number films = 8
Average PQAll = 0.67
Average PQScore = 0.78
Top films: Tie between Diabolique (#287; 1.23, 1.27) and Rififi (#316; 1.23, 1.27)
Personal favorite: Muerte de un ciclista (Death of a Cyclist) (#149; 0.68, 0.82)
Comment: For the first time since 1931, foreign films dominate – with Germany replaced by France and Spain. It also marks the shift the overseas shift of film noir, presaging La Nouvelle Vague.
1956 to 1957
Number films = 10
Average PQAll = 0.40
Average PQScore = 0.42
Top film: 12 Angry Men (#96; 1.96, 1.82)
Personal favorite: 12 Angry Men
Comment: As we reach the end of the classic era of film noir, average quality increases, albeit with fewer films.
1958 to 1959
Number films = 8
Average PQAll = 0.95
Average PQScore = 0.98
Top film: North By Northwest (#359; 1.62, 1.58)
Personal favorite: North By Northwest
Comment: Six of eight films have PQ values > 1.00 making these the top set of years overall.
1960 to 1963
Number films = 8
Average PQAll = 0.47
Average PQScore = 0.48
Top film: Psycho (#121; 1.79, 1.67)
Personal favorite: The Apartment (#85; 1.48, 1.45).
Comment: I have not seen any film released in 1961 multiple times, though I have seen Breakfast at Tiffany’s once.
1964
Number films = 6
Average PQAll = 0.84
Average PQScore = 0.90
Top film: Dr. Strangelove, or How I Stopped Worrying and Learned to Love the Bomb (#697; 1.68, 1.63)
Personal favorite: The Disorderly Orderly (#244; -0.65, -0.53)
Comment: This disconnect reflects how few films released in the 1960s I genuinely like – and how much I like this era’s Jerry Lewis films.
1965 to 1966
Number films = 6
Average PQAll = -0.31
Average PQScore = -0.30
Top film: The Sound of Music (#657; 1.12, 1.09)
Personal favorite: The Ghost and Mr. Chicken (#202; -0.18, -0.15)
Comment: Sound of Music is another great film I simply tired of watching. I have yet to see The Good, The Bad and the Ugly.
1967 to 1968
Number films = 8
Average PQAll = 0.27
Average PQScore = 0.33
Top film: The Odd Couple (#67; 0.86, 0.96)
Personal favorite: The Odd Couple
Comment: I have yet to rewatch 2001: A Space Odyssey.
1969 to 1970
Number films = 0
Comment: I have seen no film released in these two years multiple times; I have not idea what my favorite film from these two years is.
1971 to 1972
Number films = 6
Average PQAll = 0.65
Average PQScore = 0.62
Top film = The Godfather (#391; 2.54, 2.02)
Personal favorites: What’s Up, Doc? (#4; 0.68, 0.76) and Willie Wonka and the Chocolate Factory (#5; 0.77, 0.79)
Comment: And then two of my five favorite films ever are released in back-to-back years.
1973
Number films = 8
Average PQAll = 0.42
Average PQScore = 0.45
Top films: Paper Moon (#390; 1.31, 1.37) and The Sting (#98; 1.37, 1.31)
Personal favorite: The Sting
1974
Number films = 6
Average PQAll = 0.83
Average PQScore = 0.89
Top film: Chinatown (#135; 1.65, 1.62)
Personal favorite: Murder on the Orient Express (#2; 0.38, 0.42)
Comment: I will rewatch The Godfather: Part II at some point.
1975
Number films = 6
Average PQAll = 0.14
Average PQScore = 0.20
Top film: Monty Python and the Holy Grail (#581; 1.41, 1.36)
Personal favorite: Escape to Witch Mountain (#61; -0.72, -0.64)
Comment: I love Holy Grail, I just have not seen it in decades.
1976
Number films = 5
Average PQAll = 0.12
Average PQScore = 0.14
Top film: All the President’s Men (#660; 1.41, 1.42)
Personal favorite: Murder by Death (#20; -0.08, -0.07)
Comment: Ditto for Men.
1977
Number films = 6
Average PQAll = 0.43
Average PQScore = 0.42
Top film: Star Wars Episode IV: A New Hope (#694; 1.90, 1.59)
Personal favorite: High Anxiety (#158; -0.38, -0.35)
Comment: Some serious disconnect in the mid-1970s as I fondly recall movies I first saw in movie theatres as a boy.
1978
Number films = 12
Average PQAll = -0.70
Average PQScore = -0.68
Top film: Superman (#342; 0.80, 0.84)
Personal favorite: Death on the Nile (#27; 0.003, 0.01)
Comment: As solid as Superman is, The Deer Hunter (which I have not seen) is probably the best film released in 1978. Three of my 100 favorite films were released this year.
1979
Number films = 14
Average PQAll = 0.02
Average PQScore = 0.07
Top films: Being There (#703; 1.19, 1.21) and Manhattan (#79; 1.18, 1.22)
Personal favorite: The In-Laws (#47; 0.48, 0.60)
1980
Number films = 13
Average PQAll = -0.14
Average PQScore = -0.10
Top film: Airplane! (#643; 1.01, 1.06) edging Ordinary People (#407: 0.98, 1.01)
Personal favorite: Times Square (#9; -0.70, -0.57)
Comment: I have only seen Empire Strikes Back once, while I have yet to see Raging Bull. Three of my 100 favorite films were released this year.
1981
Number films = 11
Average PQAll = 0.21
Average PQScore = 0.28
Top film: Indiana Jones and the Raiders of the Lost Ark (#60; 1.84, 1.69)
Personal favorite: Indiana Jones and the Raiders of the Lost Ark
Comment: Welcome to the golden age of Harrison Ford
1982
Number films = 18
Average PQAll = 0.04
Average PQScore = 0.07
Top film: Blade Runner (#386; 1.31, 1.14) and Koyaanisqatsi (#144; 1.15, 1.18)
Personal favorites: Fast Times at Ridgemont High (#7; 0.11, 0.13)
Comment: Four of my 100 favorite films – and nine of my top 250 – were released this year.
1983
Number films = 9
Average PQAll = -0.20
Average PQScore = -0.14
Top film: A Christmas Story (#340; 1.13, 1.16)
Personal favorite: Valley Girl (#43; -0.25, -0.08)
Comment: A woman directed my favorite film in consecutive years.
1984
Number films = 23
Average PQAll = -0.28
Average PQScore = -0.23
Top film: This is Spinal Tap (#384; 1.20, 1.27)
Personal favorite: The Cotton Club (#12; -0.70, -0.70)
Comment: We are now squarely in the age of mediocre films I saw in the theater as a teenager/young adult then chose to watch again. Three of my 100 favorite films – and eight of my top 250 – were released this year.
1985
Number films = 15
Average PQAll = 0.06
Average PQScore = 0.08
Top film: Back to the Future (#42; 1.72, 1.50)
Personal favorite: The Sure Thing (#24; 0.07, 0.17)
Comment: Five of my 120 favorite films were released this year.
1986
Number films = 17
Average PQAll = -0.18
Average PQScore = -0.16
Top films: Hannah and Her Sisters (#200; 1.10, 1.12) edges Blue Velvet (#236; 1.07, 1.08)
Personal favorite: One Crazy Summer (#31; -0.90, -0.86)
Comment: I have never seen Aliens. And, hello John Cusack.
1987
Number films = 18
Average PQAll = -0.32
Average PQScore = -0.30
Top films: Wings of Desire (#115; 1.38, 1.42) edges The Princess Bride (#122; 1.34, 1.31)
Personal favorites: House of Games (#74; 0.55, 0.66) edges The Secret of My Success (#76; -0.96, -0.98)
1988
Number films = 15
Average PQAll = -0.45
Average PQScore = -0.44
Top film: Die Hard (#451; 1.50, 1.34)
Personal favorite: Who Framed Roger Rabbit (#68; 0.96, 0.97)
1989
Number films = 18
Average PQAll = -0.51
Average PQScore = -0.51
Top film: Crimes and Misdemeanors (#635; 0.97, 1.00)
Personal favorite: Uncle Buck (#162; -0.29, -0.29)
Comment: Rest in peace, John Candy.
1990
Number films = 15
Average PQAll = -0.19
Average PQScore = -0.17
Top film: Miller’s Crossing (#366, 0.95, 0.97)
Personal favorite: Metropolitan (#83; 0.56 0.65)
Comment: The one film released in 1990 in the IMDb Top 250 is Goodfellas, which I will rewatch at some point.
1991
Number films = 22
Average PQAll = -0.75
Average PQScore = -0.78
Top film: JFK (#550; 1.00, 0.85)
Personal favorite: Dead Again (#114; 0.13, 0.22)
Comment: Maybe I should watch The Silence of the Lambs again.
1992
Number films = 18
Average PQAll = -0.64
Average PQScore = -0.68
Top film: The Player (#380; 0.93, 0.98)
Personal favorite: The Public Eye (#14; -1.02, -1.04)
Comment: Maybe I should watch Reservoir Dogs again – as we hit rock bottom in the early 1990s.
1993
Number films = 14
Average PQAll = -0.74
Average PQScore = -0.75
Top film: The Fugitive (#544; 1.00, 0.94) and Dazed and Confused (#41; 0.90, 0.94)
Personal favorite: Dazed and Confused
Comment: Someday, I will watch Schindler’s List. I have also seen Jurassic Park only once.
1994
Number films = 19
Average PQAll = -0.28
Average PQScore = -0.32
Top film: Pulp Fiction (#439; 2.22, 1.74)
Personal favorite: The Shadow (#11; -1.65, -1.78) – easily the widest gap between “best” and “favorite”
Comment: These data are deceptive. Hollywood has entered a new golden age, rivaling its best years. Remember, I have only seen Shawshank Redemption, Forrest Gump and Léon: The Professional once. And I have never seen The Lion King. These four movies and Pulp Fiction are in the top 40 films by IMDb score.
1995
Number films = 13
Average PQAll = -0.17
Average PQScore = -0.24
Top films: The Usual Suspects (#16; 1.45, 1.21) edges Heat (#245; 1.39, 1.15) and Toy Story (#332; 1.36, 1.18)
Personal favorite: The Usual Suspects
Comment: Eight of the IMDb Top 250 were released in 1995.
1996
Number films = 16
Average PQAll = -0.32
Average PQScore = -0.33
Top film: Fargo (#479; 1.43, 1.31)
Personal favorite: Beatiful Girls (#126; 0.23, 0.27)
1997
Number films = 11
Average PQAll = 0.38
Average PQScore = 0.31
Top film: L.A. Confidential (#1; 1.60, 1.45)
Personal favorite: L.A. Confidential
Comment: I am still upset L.A. Confidential did not win the Academy Award for Best Picture; Titanic is not even in the IMDb Top 250; L.A. Confidential only ranks 5th for the year.
1998
Number films = 17
Average PQAll = -0.18
Average PQScore = -0.21
Top films: Rushmore (#301; 1.07, 1.07) and The Big Lebowski (#433; 1.17, 0.96)
Personal favorite: Pleasantville (#38; 0.53, 0.45)
Comment: I have zero interest in Saving Private Ryan.
1999
Number films = 16
Average PQAll = -0.27
Average PQScore = -0.40
Top film: Toy Story 2 (#530; 1.33, 1.19)
Personal favorites: Cradle Will Rock (#19; -0.26, -0.31)
Comment: I may watch Fight Club and The Matrix again at some point.
2000
Number films = 6
Average PQAll = -0.06
Average PQScore = -0.09
Top film: Almost Famous (#161; 1.18, 1.03)
Personal favorite: Almost Famous
2001
Number films = 8
Average PQAll = 0.64
Average PQScore = 0.43
Top film: Memento (#265; 1.55, 1.19)
Personal favorite: Mulholland Drive (#6; 1.03, 0.79)
2002 to 2003
Number films = 6
Average PQAll = -0.14
Average PQScore = -0.40
Top film: Big Fish (#354; 0.99, 0.67)
Personal favorite: School of Rock (#160; 0.16, -0.05) and Spider-Man (#176; 0.33, -0.03)
2004
Number films = 5
Average PQAll = 0.55
Average PQScore = 0.37
Top film: In America (#525; 0.99, 0.91)
Personal favorite: Collateral (#190; 0.76, 0.53)
2005 to 2006
Number films = 10
Average PQAll = 0.49
Average PQScore = 0.18
Top film: The Departed (#326; 1.84, 1.30)
Personal favorite: The Prestige (#137; 1.24, 0.73)
2007 to 2008
Number films = 6
Average PQAll = 0.14
Average PQScore = -0.21
Top film: The Dark Knight (#88; 2.25, 1.40)
Personal favorite: The Dark Knight
2009
Number films = 5
Average PQAll = 0.39
Average PQScore = 0.00
Top film: Up (#398; 1.67, 1.29)
Personal favorite: Watchmen (#127; 0.36, -0.18)
2010-12
Number films = 10
Average PQAll = 0.91
Average PQScore = 0.53
Top film: Inception (#261; 2.02, 1.09)
Personal favorite: Moonrise Kingdom (#0.83; 1.15, 0.92)
2013 to 2014
Number films = 5
Average PQAll = 0.90
Average PQScore = 0.56
Top films: The Grand Budapest Hotel (#137; 1.43, 1.03) and Interstellar (#264; 1.52, 0.65)
Personal favorites: Tie: Predestination (#65; 0.27, 0.07) and Coherence (#65; 0.36, 0.36)
2015 to 2020
Number films = 5
Average PQAll = 1.11
Average PQScore = 0.68
Top film: Avengers: Endgame (#325; 2.05, 1.31)
Personal favorite: Tenet (#29; 0.65, 0.17)
Comment: And we come full circle back to the 1920s and 1930s in terms of relative quality.
**********
Figure 4 reinforces the year-by-year analysis. It shows early and late peaks: one for the 1920s because I carefully chose the best films to watch and rewatch, and one for the 2010s, because I stopped seeing movies in theatres first, choosing the best films to watch (OK, and all 23 Marvel Cinematic Universe films) then watch again. Moreover, average PQAll is higher than average PQScore until about 1960 – when it basically draws even until the early 1990s. Around 2000, average PQScore pulls much further ahead for the same reason.
After a sharp decline in both values through the 1930s (excepting a slight uptick in 1931) – reflecting the Fox Charlie Chan films I love more than most – the emergence of film noir around 1940 pulls values up again. They generally stay above 0 through the early 1950s, peaking sharply in 1944. Some exceptional Hitchcock, Billy Wilder and foreign films send scores skyrocketing in the late 1950s, with a lower peak from the 1960s into the mid-1970s: once again a lack of films elevates scores.
Figure 4: Average PQAll and PQScores by Year of Release/Midpoint of Range of Year of Release, 1920-2020

The two scores track very closely except for two periods. The first is from 1920 to 1935, when mean PQScore is consistenly higher, 0.13 on average. The second – and far more dramatic – begins in 1999, after which PQAll averages 0.27 higher. By its very nature, PQAll favors newer, longer and more-often-rated films relative to PQScore. Given a choice, I prefer the latter measure, which reduces recency bias to near zero. It is a testament to how highly-regarded Pulp Fiction is that it is the only film in both top 10s released in the last 40 years.
Almost by definition, I first saw any film released through the mid-1970s, not in a movie theater, but on television, through one of Yale’s films societies or through a rental/streaming service. This will inevitably bias toward “better” films. That changed in the late 1970s, when I began regularly seeing films for the first time in a movie theater – resulting in a much wider range of quality. The steep decline in scores in 1978 shows that, as does the zig-zagging around 0 through the mid-1980s. I cannot really explain why scores plummet in the late 1980s and early 1990s, though there is evidence overall film quality was much lower in those year.
The sharp spike up in 1994 masks an even more dramatic increase in overall film quality. I have long thought the peace and prosperity of the last six years of the Clinton Administration yielded a new golden age in American cinema; perhaps studio executives felt freer to experiment with original screenplays. I also though that changed after the 9-11, but…maybe not. Still, I suspect the preponderance of post-2000 films in the IMDb Top 250 reflects recency bias more than actual quality.
Basically, while I consider myself a cinephile, like everyone who watches movies my tastes range from genuine works of art to the guiltiest of guilty pleasures. And that is how it is supposed to be – we like what we like, not what we are “supposed” to like. Still, whether I am simply more honest in admitting how much I genuinely like the Fox Charlie Chan films, and films like Deadline at Dawn, Impact, Thank God It’s Friday, Times Square, The Cotton Club, The Public Eye, The Shadow, Cradle Will Rock and Watchmen remains to be seen.
Until next time…and if you like what you read on this website, please consider making a donation. Thank you.
[1] New York, NY: New American Library
[2] StataCorp. 2005. Stata Statistical Software: Release 9. College Station, TX: StataCorp LP.
[3] Specifically: factor analysis, principal factors, varimax rotation, forcing one or two factors, depending on input variables.
[4] Using “Predict” command in Stata
[5] Despite my ambivalence about Allen as a human being, I still love many of his films.


4 thoughts on “Measuring Film Quality: Revisiting “Guilty Pleasures””