I trace my love of the Philadelphia Phillies to my father. As a 15-year-old fan, he convinced members of the 1950 National League Champion “Whiz Kid” Phillies to sign his autograph book. Phillies games always seemed to be playing on the car radio when I was young, the mellifluous baritone of Harry Kalas and the flat Nebraska drawl of Richie “Whitey” Ashburn floating in the air.
As a child, I was one of those “scared of the ball” kids, but because my father loved baseball I sort of liked it too. I have warm memories of him taking me to Veterans Stadium to watch the Phillies play (it always felt like we were playing the Montreal Expos, and we always lost 3-2). I would smell, then sip, his weak ballpark beer, not really liking it. And I do not recall how many times he tried to explain to me what an “RBI” was; despite my mathematical bent, I just could not wrap my head around a “run batted in.”
Until…some six years after his death, watching parts of the 1988 National League (NL) Championship Series between the Los Angeles Dodgers and the New York Mets, it all just sort of clicked.
**********
Since their founding in 1883 as the Philadelphia Quakers, the Phillies have mostly been very bad. In that first season, they went 17-81, winning just 17.3% of their games. During one particularly brutal stretch (1918-1948), they won just 37.3% of their games (1,752-2,939).
It is a wonderful bit of irony that, in 2007, on their way to an 89-73 record, their first playoff berth since 1993, and the start of a five-year run as NL East champions, the Phillies would become the first professional sports franchise to lose 10,000 games.
Overall, in their 135 seasons, the Phillies have won 47.1% of their games (9,664-10,836) games. However, as Figure 1 shows, they have been a little better—if just as streaky—during my lifetime (4,024-4,108, 49.5%).
Figure 1: Philadelphia Phillies Winning Percentage, 1967-2017
Following the collapse of 1964, when the Phillies had a 6½ game lead on the St. Louis Cardinals in the NL[1] with 12 games to play…and the Cardinals roared back to become League Champions, the team went into freefall, bottoming out at 57-99 in the strike-shortened 1972 season. However, by 1975, future Hall-of-Famers like left-handed pitcher (LHP) Steve Carlton and third baseman Mike Schmidt had them winning 86 games. Between 1976 and 1983, the Phillies made the playoffs six times, getting to the World Series twice (1980, 1983), winning it for the first time ever in 1980.
Between 1984 and 1987, the Phillies nearly broke even (322-325; 49.8%). And then the bottom fell out again: excluding the fluke 1993 NL Championship[2], between 1988 and 2000[3], the Phillies won only 44.3% of their games[4].
I started avidly following the Phillies in 1989, coincidentally the year I moved to Boston to start a doctoral program. And while I started following the Boston Red Sox as well, the Phillies remained my favorites. They were my link to my childhood in the Philadelphia suburbs and to my late father. In those days, Phillies games were broadcast on 1210AM, which transmitted at a powerful 50,000 watts. I could thus listen to night games (after sunset) on my radio; one night in September 1992, I listened to the Phillies game while driving a rental car in northwestern Iowa![5] The broadcast was often plagued by static, but the later it got, the more clear the signal became. I would often take long walks listening to the game on my Walkman radio, startling passers-by with a sudden whoop of joy or anguished cursing.
It wasn’t just the games. It was the broadcasters. Harry and Whitey were still broadcasting (though Whitey would die in September 1997), supplemented by Andy Musser and Chris “Wheels” Wheeler. Night after night, they were the reassuring and comforting voices of old friends. I learned more about the game of baseball from Wheels, whose strong Philadelphia accent reminded me of my own family, than from any other announcer. Ever.
That visceral connection to the radio announcers persists. One negative consequence of the Phillies’ poor play since 2013 has been spending far less time listening to the superb team of Scott Franzke and Larry Andersen (a Vaudeville act for the 21st century)
In 2001, as I returned to my hometown for a four-year hiatus, the Phillies started a 12-year run of excellence, highlighted by those five consecutive NL East Championships (2007-11), two NL Championships (2008, 2009) and their second World’s Championship (2008). In 2001, 2003 and 2005 they missed the playoffs by a median two wins. Overall, the Phillies they won 54.8% of their games from 2001 through 2012 (1,065-878).
Aging players not traded or released soon enough doomed the Phillies to identical 73-89 records in 2013 and 2014; following the latter season, superstar shortstop Jimmy Rollins was traded to the Los Angeles Dodgers, marking the unofficial start of a long rebuilding process. The bottom completely dropped out in 2015, as the Phillies went 63-99. They improved somewhat in 2016 (71-91) before sinking again to 66-96 in 2017. Overall, from 2013 to 2017, the Phillies record was 346-464 (42.7%).
**********
Just bear with me while I examine the 2017 season in more detail.
Figure 2 charts the Phillies’ daily record in 2017, starting with game 30 (a 10-innning 6-5 win over the Washington Nationals), both overall (“cumulative”) and in 30-day increments.
Figure 2: 2017 Phillies Win Percentage, Cumulative and in 30-Game Increments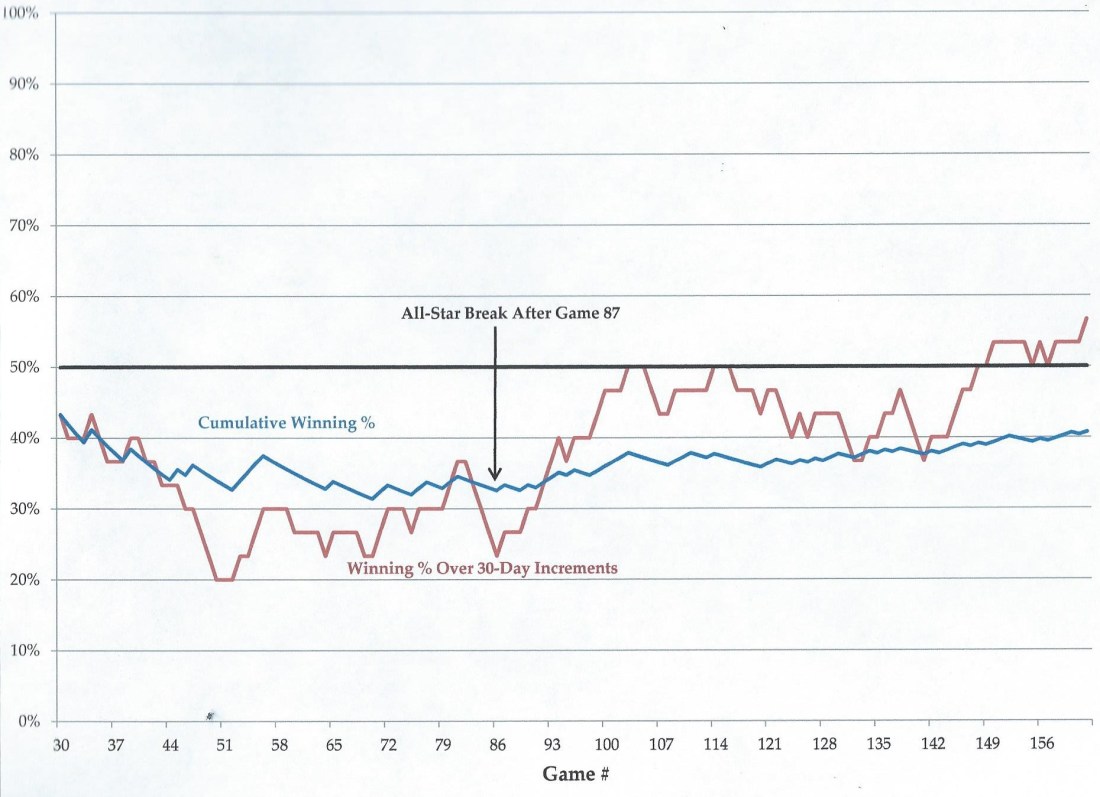
The 2017 season started well: after beating the Miami Marlins 3-2 on April 27, the Phillies were 11-9 (55.0%).
From that day until the end of the first “half” (a 7-1 win over the San Diego Padres), though, the Phillies went 18-49 (26.9%), to finish the first half an abysmal 29-58 (33.3%), putting them on pace to finish the season a historically-bad 54-108.
The four-day All-Star respite was a turning point, however. After losing three of the first four games once play resumed on July 14, the Phillies won nine of their next 12. Overall, the team went 37-38 over their last 75 games, playing the equivalent of an 80-82 season over the 2nd half of 2017.
It may not sound like much, but I will gladly take the full-season equivalent of 26-win improvement between the first and second “halves” of the 2017 season.
And why were the Phillies so much better in the 2nd half of 2017?
One word: offense.
Offense. The Phillies were outscored 424 to 332 in the 1st half of 2017, while breaking even (358-358)[6] in the 2nd half. Put another way, while the Phillies allowed as many runs per game (4.8) in the 2nd half as in the 1st half (4.9), they scored a full run more per game in the 2nd half (4.8 vs. 3.8).
Table 1: Offensive Statistics by Position, Before and After 2017 All-Star Break
| POS | Player | OPS* | aIOA† | Player | OPS | aIOA | ΔOPS | ΔaIOA |
| C | Cameron Rupp | 0.680 | 36.7 | Cameron Rupp | 0.767 | 43.1 | +0.087 | +6.4 |
| 1B | Tommy Joseph | 0.779 | 90.7 | Tommy Joseph | 0.635 | 49.4 | -0.144 | -41.3 |
| 2B | Cesar Hernandez | 0.735 | 69.8 | Cesar Hernandez | 0.842 | 117.6 | +0.107 | +47.8 |
| SS | Freddy Galvis | 0.724 | 81.7 | Freddy
Galvis |
0.653 | 91.2 | -0.071 | +9.6 |
| 3B | Mikael Franco | 0.657 | 78.3 | Mikael
Franco |
0.730 | 85.1 | +0.073 | +6.9 |
| LF | Daniel
Nava |
0.800 | 43.9 | Rhys
Hoskins |
1.014 | 148.9 | +0.214 | +105.0 |
| CF | Odubel Herrera | 0.685 | 71.7 | Odubel Herrera | 0.928 | 111.2 | +0.243 | +39.5 |
| RF | Aaron Altherr | 0.886 | 116.1 | Nick Williams | 0.886 | 116.1 | -0.071 | +32.2 |
| START | 8 Players | 0.740 | 582.0 | 8 Players | 0.793 | 775.8 | +0.054 | +193.8 |
| BENCH | 5 Players†† | 0.664 | 141.6 | 5 Players††† | 0.738 | 147.4 | +0.074 | +5.8 |
| TOTAL | 16 Players | 0.716 | 740.7 | 20 Players | 0.778 | 1019.2 | +0.063 | +278.5 |
* On-base percentage plus slugging percentage
† Index of Offensive Ability standardized to a 162-game season
†† OF Michael Saunders[7], C Andrew Knapp, LF/2B Howie Kendrick[8], INF Andres Blanco, 1B Brock Stassi
††† OF Aaron Altherr, C Jorge Alfaro, OF Hyun Soo Kim, 3B/SS J. P. Crawford, C Andrew Knapp
Table 1 pinpoints precisely where the offense improved. It summarizes the offensive performances ([OPS], my Index of Offensive Ability standardized to a 162-game season [aIOA][9]) for the players with the most plate appearances (PA) at each position (excluding pitcher), before (left-hand side) and after (right-hand side) the 2017 All-Star Break.
Before the All-Star Break, the Phillies’ primary eight starting position players, led by right fielder Aaron Altherr (0.886 OPS, 116.1 aIOA[10]) and first baseman Tommy Joseph (0.779, 90.7), combined for a good-but-not-great 0.740 OPS and 582.0 aIOA. The problem was that the three 1st-half PA leaders had average-to-mediocre offensive performances: shortstop Freddy Galvis (0.724, 81.7 in 348 PA), third baseman Mikael Franco (0.657, 78.3 in 347 PA) and center fielder Odubel Herrera (0.685, 71.7 in 346 PA). The primary five-man bench (i.e., the five non-starting hitters with the most PA) was also subpar, combining for a dismal 0.664 OPS and 141.6 aIOA. Overall, Phillies hitters combined for a below-average 0.716 OPS and 740.7 aIOA in the 1st half of 2017.
After the All-Star Break, however, the offense improved dramatically. A slightly altered lineup of eight regular hitters combined for a 0.793 OPS and 775.8 aIOA, up 0.054 and +193.8 from the 1st half. The primary five-man bench was also better offensively in the 2nd half, producing a respectable 0.738 OPS (+0.074) and 147.4 aIOA (+5.8). Overall, Phillies hitters combined for a solid 0.778 OPS (+0.063) and 1019.2 aIOA (+278.5) in the 2nd half of 2017.
The 2nd-half charge was led by two talented holdovers (Herrera and second baseman Cesar Hernandez) and two dynamic rookies (left fielder/first baseman Rhys Hoskins and right fielder Nick Williams). Herrera, the Phillies’ lone 2016 All-Star, saw his OPS jump 0.243 and his aIOA jump 39.5 in the 2nd half; overall he finished the year with a 0.778 OPS in 563 PA and a respectable 86.7 IOA, 3rd on the team. Hernandez saw his OPS jump 0.107 and his aIOA jump 47.8 in the 2nd half; overall he finished the year with a 0.793 OPS in 577 PA and a team-leading 91.7 IOA. Altherr was 2nd overall in aIOA in 2017, despite losing time in the 2nd half to injuries, producing an All-Star-level 0.856 OPS, albeit in only 412 PA.
But the truly exciting players to watch in 2018 may be Williams and Hoskins, each just 24 years old. Williams, acquired in the July 2015 trade that sent LHPs Cole Hamels and Jake Diekman to the Texas Rangers, made his major league debut on June 30. In his 343 PA, he had an 0.811 OPS and 71.6 IOA (equivalent to a very strong 139.7 over 162 games). Hoskins, selected by the Phillies in the 5th round of the 2014 MLB Draft, made his debut on August 10. In only 212 PA, he hit 18 home runs (HR) and drove in 48 runs, finishing with an astonishing 1.014 OPS and 69.0 IOA (equivalent to an MVP-level 223.4 over 162 games).
Those five players (with Hoskins at his more natural first base[11]), along with some combination of Franco, Galvis and rookie J.P. Crawford at shortstop and third base, and some combination of Rupp and rookies Andrew Knapp and Jorge Alfaro, also acquired in the Hamels deal, at catcher could provide the Phillies a vastly improved offense in 2018. That offense could also benefit from resigning a healthy Daniel Nava, who had a 0.814 OPS with a 31.3 IOA in 214 PA for the 2017 Phillies.
Pitching. Here there is less reason for optimism in 2018, as Tables 2a and 2b reveal.
Table 2a: 2017 Phillies Pitching Before 2017 All-Star Break
| Category | W-L | ERA | OOPS* | IP/G | K/9 | aIP/OOPS† | aSPI/aRPI†† |
| Top 5 Starters | 16-27 | 4.51 | 0.768 | 5.6 | 7.8 | 905.5 | 960.9 |
| All 9 Starters | 18-36 | 4.68 | 0.790 | 5.6 | 7.1 | 1146.7 | 1195.9 |
| Top 7 Relievers | 10-20 | 4.14 | 0.719 | 2.6 | 8.7 | 579.7 | 625.4 |
| All 16 Relievers | 11-22 | 4.59 | 0.753 | 3.3 | 8.5 | 713.4 | 687.5 |
| Total††† | 29-58 | 4.65 | 0.776 | 8.9 | 7.6 | 1859.0 | n/a |
* OPS by batters faced, standardized to 162-game season
† IP divided by OOPS standardized to a 162-game season
†† Starting Pitcher Index (SPI) or Relief Pitcher Index (RPI) standardized to a 162-game season
††† Mark Leiter, Jr. made 3 starts and 12 relief appearances before the All-Star Break. His performances are separated into each pitching category.
Table 2b: 2017 Phillies Pitching After 2017 All-Star Break
| Category | W-L | ERA | OOPS | IP/G | K/9 | aIP/OOPS | aSPI/aRPI |
| Top 5 Starters | 20-19 | 5.13 | 0.802 | 5.5 | 9.1 | 803.2 | 876.0 |
| All 10 Starters | 25-26 | 4.95 | 0.795 | 5.4 | 8.4 | 1096.3 | 1164.4 |
| Top 7 Relievers | 8-10 | 3.75 | 0.702 | 2.7 | 9.0 | 612.4 | 682.5 |
| All 16 Relievers | 12-12 | 3.74 | 0.681 | 3.5 | 9.5 | 831.8 | 909.2 |
| Total* | 37-38 | 4.47 | 0.763 | 8.9 | 8.8 | 1886.0 | n/a |
* Mark Leiter, Jr. made 8 starts and 4 relief appearances after the All-Star Break. His performances are separated into each pitching category.
In the 1st half of 2017, five right-handed pitchers (RHP)—Jeremy Hellickson, Jerad Eickhoff, Aaron Nola, Nick Pivetta and Vince Velasquez—combined to start 67 games. The best starter, by far, was Nola, the Phillies’ 1st-round pick in 2014. He pitched to a 6-6 record with a solid 3.59 ERA, 0.644 OOPS and 9.1 strikeouts per nine innings (K/9) in 13 starts, averaging 6.2 IP/S.
In the mid-1990s, I developed two metrics for assessing starting pitchers. One is simply IP/OOPS (applicable to any pitcher); the second is a Starting Pitcher Index (SPI)[12]. In the 1st half of 2017, Nola had an aIP/OOPS of 232.2, 2nd behind Hellickson (235.8), and an adjusted aSPI of 310.5, ahead of Hellickson (270.9) [13] and Eickhoff (260.5).
The bullpen was better, though still not good. Seven relievers—RHP Hector Neris, Pat Neshek, Luis Garcia, Joaquin Benoit, Edubray Ramos and Jeanmar Gomez, plus LHP Joely Rodriguez—combined to pitch 224.0 of the 288.1 innings logged by Phillies’ relievers in the 1st half of 2017. The best 1st-half reliever by far was Neshek, the Phillies’ lone 2017 All-Star,[14], who was 2-2 with a microscopic 1.27 ERA, 0.540 OOPS and 9.2 K/9 in 35.1 IP (38 games), converting 10 of 12 (83.3%) holds/saves.
I also developed a RPI (Relief Pitcher Index)[15]. Neshek led 1st-half relievers with a 121.8 aIP/OOPS, well ahead of Garcia (110.8), Neris (106.9) and Benoit (97.7), as well as a 241.6 aRPI, lapping Neris (202.9) and Benoit[16] (186.8).
In the 2nd half of 2017, the starting pitching actually got slightly worse while the bullpen was greatly improved. By most measures—ERA (+0.27), OOPS (+0.05), IP/S (-0.2), aIP/OOPS (-53.4) and aSPI (-31.5)—Phillies starting pitching was worse in the 2nd half than in the 1st half. Only on wins (+7), losses (-10) and K/9 (7.1 to 8.4) did they improve.
Five starters—Pivetta, Nola, Eickhoff, Mark Leiter Jr. and Ben Lively—combined for 54 starts. Nola was again the best starter, going 6-5 with a solid 3.49 ERA, 0.712 OOPS and 10.3 K/9, averaging 6.3 IP/S; his 2nd-half aIP/OOPS of 266.0 and aSPI of 361.0 were both well ahead of Pivetta’s 187.4 and 258.7, respectively.
The bullpen, however, was demonstrably better. By every measure: wins (+1), losses (-10), saves (11 to 22), holds (32 to 41), hold/save percentage (75.4 to 86.3%), ERA (-0.85), K/9 (8.5 to 9.5), aIP/OOPS (+118.4) and aSPI (+221.7), Phillies relievers improved in the second half.
Seven relievers—Neris, Garcia, LHP Adam Morgan, LHP Hoby Milner, Ramos, RHP Ricardo Pinto and RHP Jesen Therrien—combined to pitch 199.0 of the 262.1 innings logged by Phillies’ relievers in the 2nd half of 2017. Neris, Garcia, Morgan, Milner and Ramos led the 2nd-half bullpen improvement, pitching 160.0 innings (some combination of these five relievers averaged 2.1 innings per game), going 8-8 with a 2.53 ERA, 0.641 OOPS and 9.6 K/9, converting 53 of 60 hold/save opportunities (88.3%). They combined for a 539.0 aIP/OOPS and 621.4 aRPI.
Overall, Phillies pitching was slightly better in the 2nd half than in the 1st half. The staff ERA dropped from 4.65 to 4.47 (still not great), while staff OOPS dropped from 0.776 to 0.763. The staff strikeout rate did substantially improve from 7.6 to 8.8; aIP/OOPS increased incrementally from 1859.0 to 1886.0.
None of this means the Phillies will even have a winning record in 2018, let alone make the playoffs. What it does mean is that young, exciting players like Altherr, Hernandez, Herrera, Hoskins and Williams (plus Alfaro, Crawford and Knapp), young pitchers like Nola and, if he can return to form, Eickhoff (2015-16: 14-17, 3.44 ERA, 6.1 IP/S in 44 starts)[17], and a power bullpen led by Neris, Garcia, Morgan, Milner and Ramos should make the Phillies entertaining to follow again in 2018.
Until next time…
[1] Prior to 1969, there were only the two Leagues—National and American—and the teams that finished first in each League met in the World Series. The Cardinals beat the New York Yankees in seven games in 1964. Divisional play debuted in 1969, followed by the Wild Card in 1995.
[2] They lost the World Series to the defending World Champion Toronto Blue Jays in six games.
[3] In total, 65 games were lost in 1994 (47) and 1995 (18) to the 1994-95 players’ strike.
[4] Even if you include 1993 (97-65, 59.9%), the Phillies still averaged only 71.5-85.5 (45.5%).
[5] Mitch Williams blew a save, and the Phillies lost to the Atlanta Braves, 6-5.
[6] It took a heroic 11-0 win over the New York Mets on the last day of the season, October 1, to break even in 2nd-half run differential.
[7] Saunders was released on June 23.
[8] Kendrick was traded to the Washington Nationals on July 28.
[9] IOA is the sum of two values, runs produced (runs + RBI – home runs) and 0.5 * stolen bases * stolen base percentage, multiplied by OPS. I standardized it to a 162-game season by multiplying it by 162 and dividing it by the number of games in the 1st half (87) or 2nd half (75).
[10] I believe he and second baseman Cesar Hernandez had a very good shot to make the All Star team until each was derailed by injuries.
[11] Joseph’s 2nd half offensive decline may well have resulted from losing playing time to Hoskins.
[12] It is the sum of the sum of three values (IP, [wins/wins-plus-losses]*10[12], K/9 * 5) divided by OOPS
[13] He was traded to the Baltimore Orioles on July 29.
[14] And who was then traded to the Colorado Rockies on Jul 26.
[15] It is the sum of four values (IP * % inherited runners stranded, [wins/wins-plus-losses]*10, K/9 * 5, [saves+holds]*save-hold percentage) divided by OOPS. I was unable to find inherited runners scored values broken down by season halves, so I used the full-season values for both halves.
[16] Benoit was traded to the Pittsburgh Pirates on July 31.
[17] And maybe Jake Thompson (3-2, 3.27 ERA in 8 starts, though only 5.1 IP/S) and Lively (4-7, 4.26 ERA, 5.9 IP/S in 15 starts)? Thompson and Eickhoff were ALSO acquired in the Hamels deal, while Lively arrived in the December 2014 trade that sent right fielder Marlon Byrd to the Cincinnati Reds.


5 thoughts on “Phollowing the Philadelphia Phillies is phun again”